Version 7.0.0
And here is a new update, almost a month after the previous one. We’re starting to have software here that’s holding up pretty well 😄
A huge amount of work went into this update, but not necessarily visible at first glance. Let’s take stock.
– First of all, a little over a week of work was needed to rework the entire infrastructure of the chart display page. As a user, you won’t notice anything. But as a developer, you should know that when you open a chart, 4 code pages of more than 6000 lines of code each fight it out to give you what you want. Depending on whether you open a simple chart or a synastry, whether you’re on a computer, a phone, a tablet, Android, iOS, Mac or Windows, this page or that page takes over. It was… unmanageable! So every modification had to be done 4 times. A purge. But after a big overhaul that cost me more than one nervous breakdown, I managed to make everything fit into a single page of more than 9000 lines of code. So: less space used by the application, and less work for me in the future.
– In a somewhat futile and light-hearted way, color changes were made here and there, and this will probably continue in the future, in order to unify the graphic identity around the sky-blue shade that Odysseus® has been wearing since day one. Nothing very revolutionary, but some purple colors here and there inherited from the flutter/dart system I use to code kept haunting a few pages, which really got under my skin.
– An improvement to the visuals of the PDF listings has been made because until now, exporting generated several grouped tables instead of a single one. It’s a detail, but the whole thing is more consistent.
– The Lunar Nodes texts W have been corrected on certain points… but I admit I’m seriously considering rewriting all the House texts entirely, to summarize them either into a single paragraph or into a series of keywords. I don’t know yet and I admit I’m short on time for that work. But I promise, it will come!
– The toggles now have their “state” remembered. That is, if you use for example Cusp mode (the Arc 🏹 toggle) and you close the chart, when you come back, it will still be enabled. Likewise, the state of the “Guide” is also preserved. So if you prefer to display a guide with 8 lines, or 4, or 1, instead of 16, that will be preserved.
– An unexpected fix was made to time zones (yes, again! We’ll never see the end of it…) because territories separated from the mainland (like the overseas departments/territories for France, for example) didn’t have the right time zone when they were entered via geolocation. That’s now fixed. Still, stay vigilant about the time zone for more exotic territories or for older dates.
– Two important fixes were made: the Place Daily Chart, which was loading a conjunction <-N instead of an opposition, and the Personal Daily Chart, which did not take into account the daylight saving time change of Level 1/Natal.
– The chart creation page now remembers the last chart you opened.
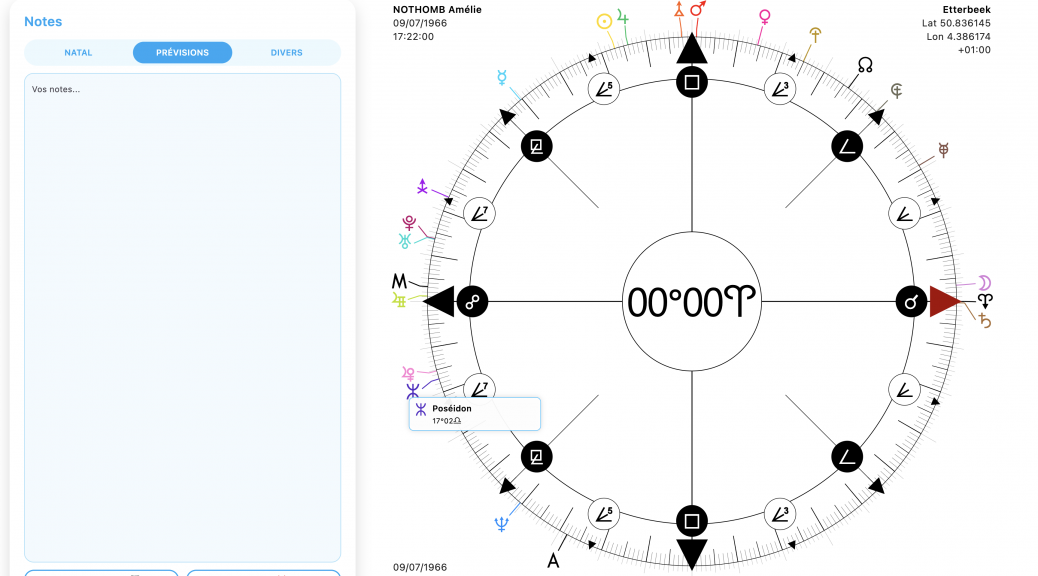
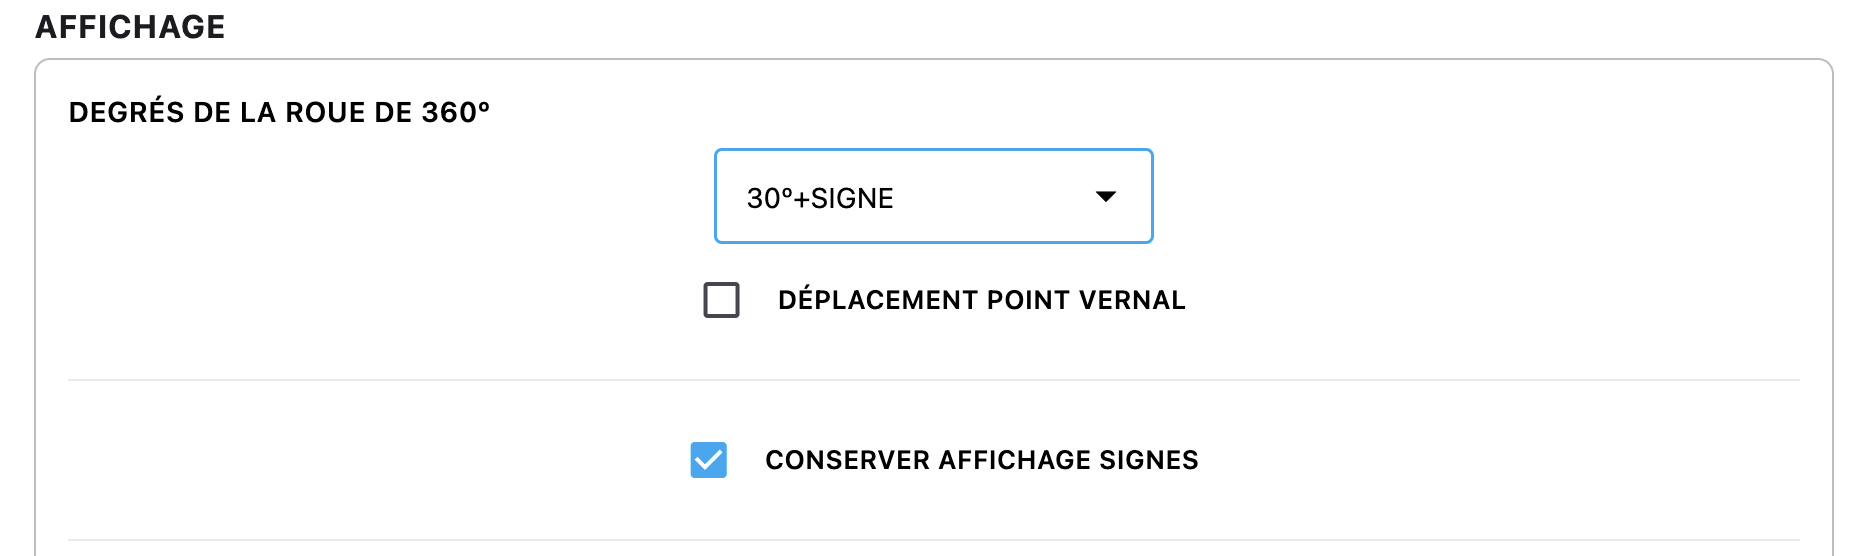
– When you’re on the 360º wheel in Cusp mode, if you click the Vernal Point A, the zodiac signs are displayed. But as soon as you move the wheel, they disappear. Now, an option in the configuration panel allows you to keep them:
– The Graphemere (long press on 📊) now displays customized elements (midpoints, sensitive points) in transit, which it previously only did for natal, directed, and progressed.
– Likewise, you can call it from the chart creation page in order to simply see transits, without a base chart. But beware, it isn’t available for synastry. I think that will come in a future update to show transits on the composite. But I’m not sure it will interest many people…
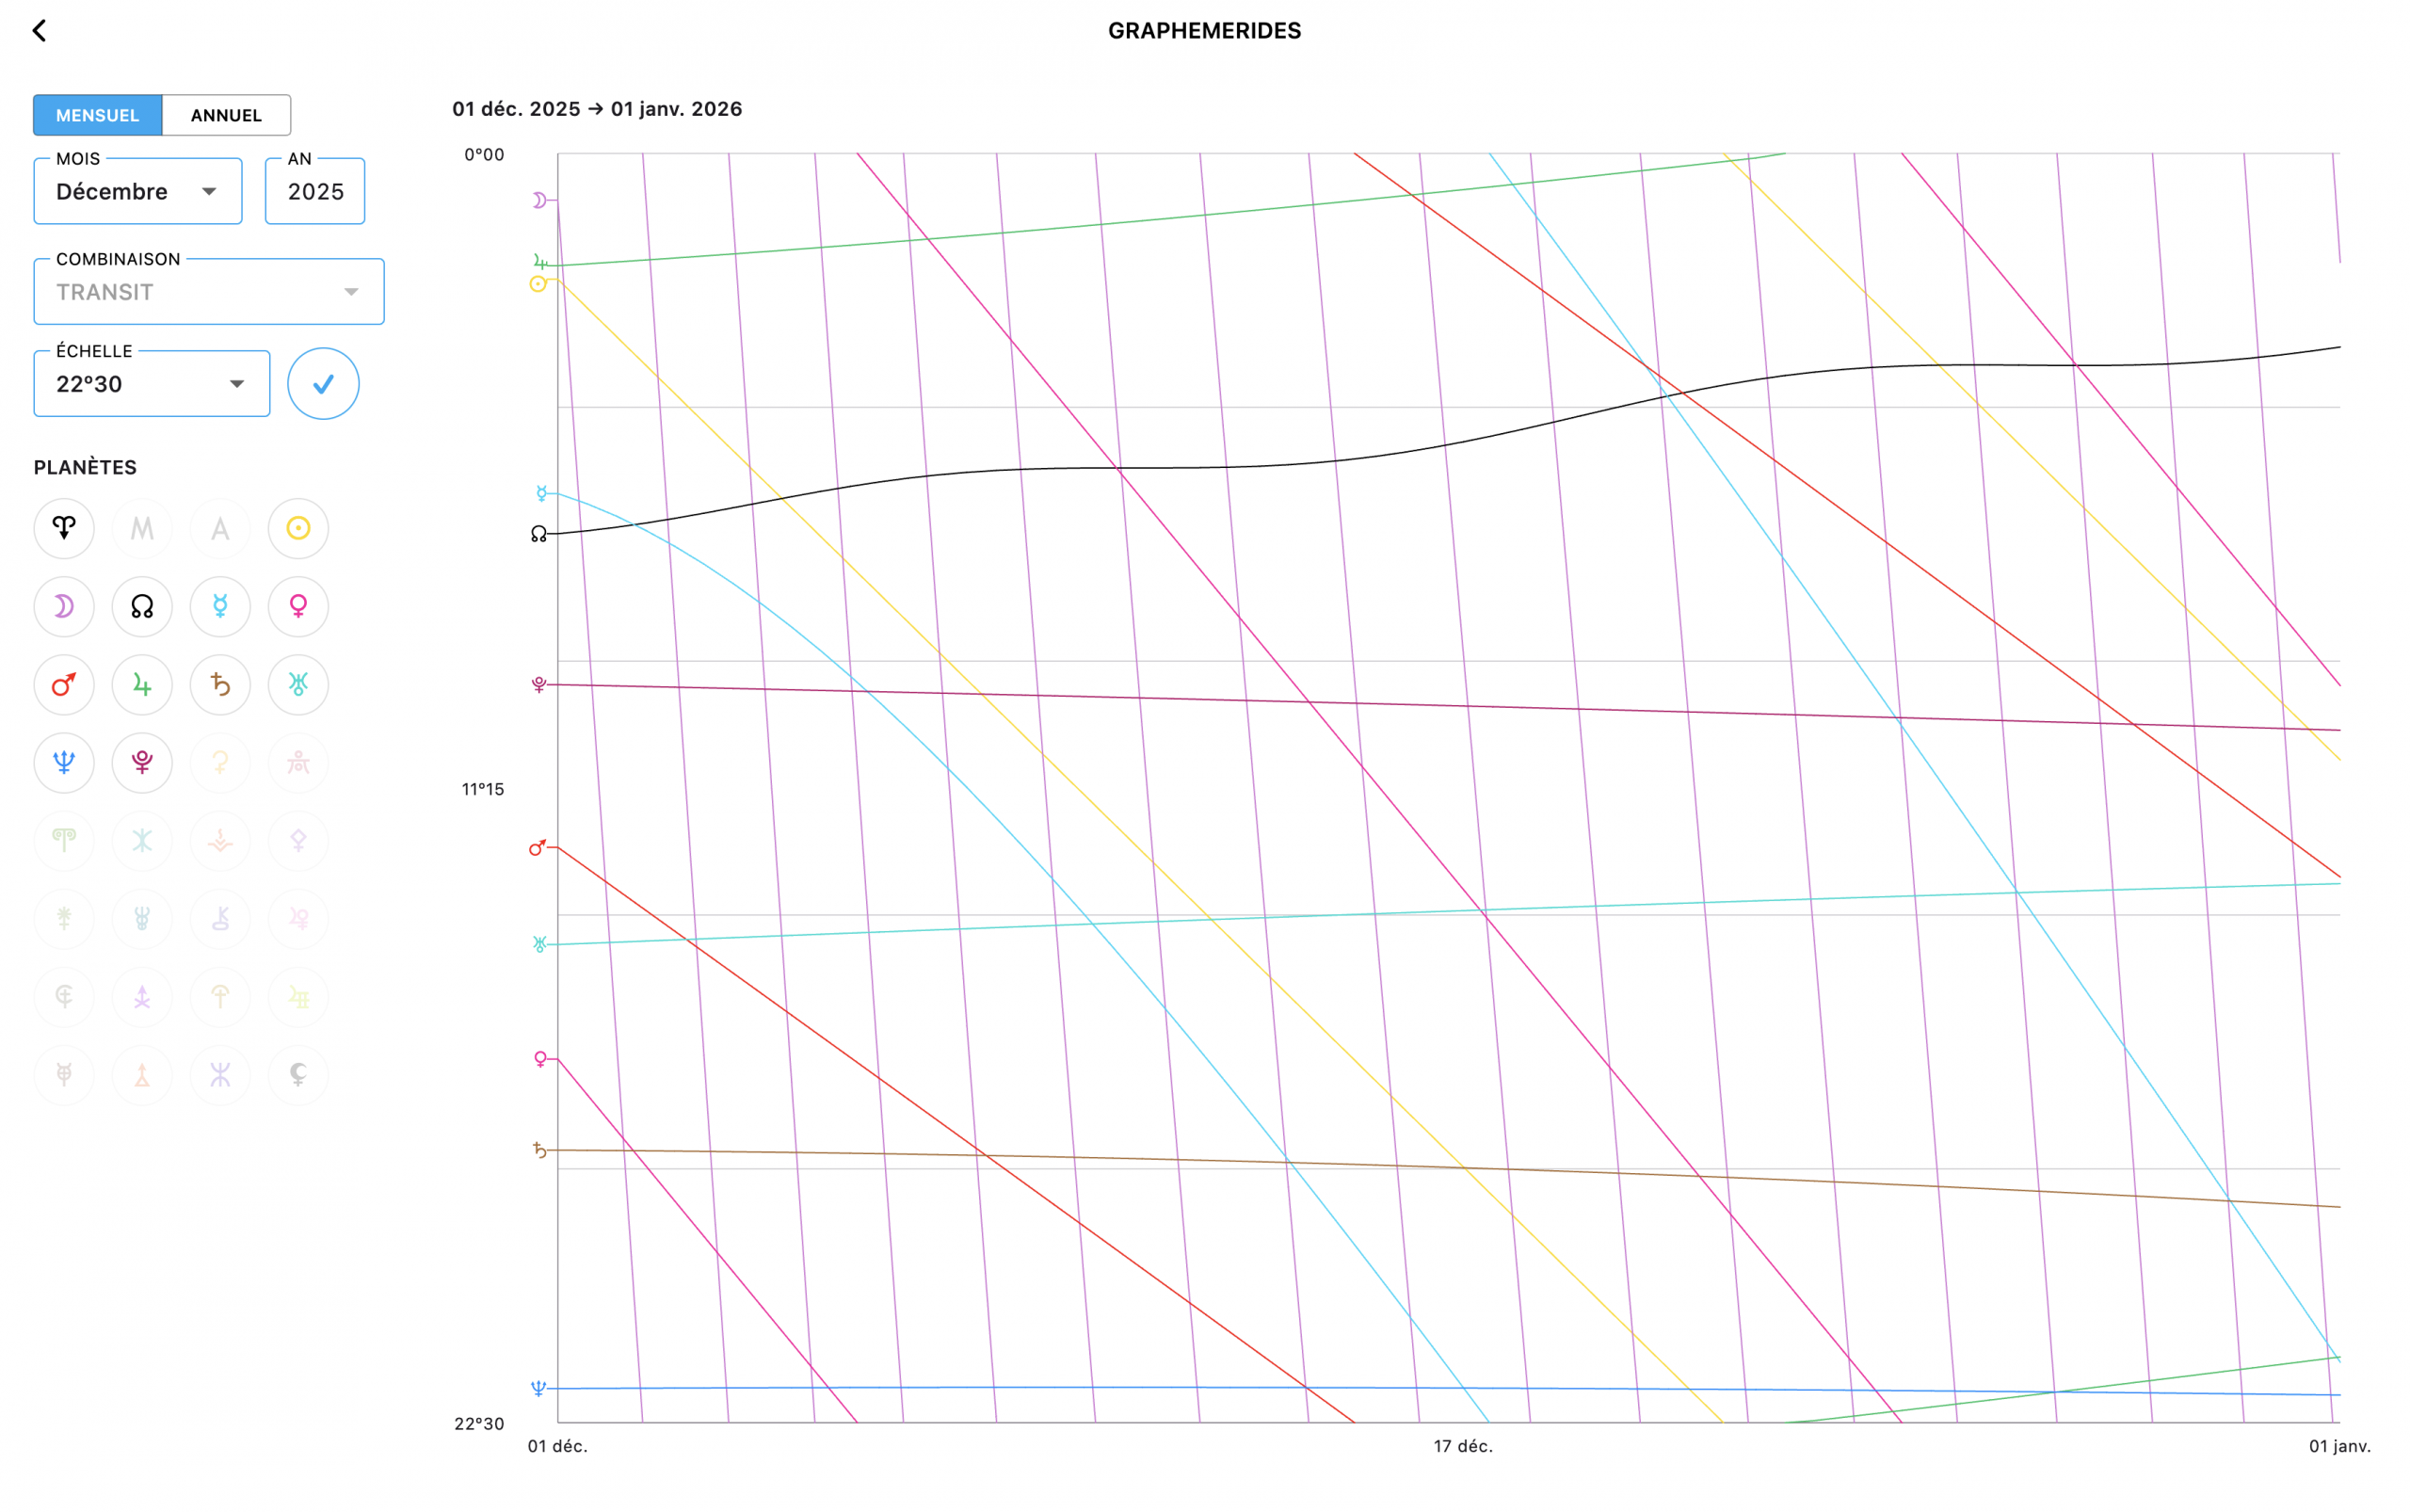
– Also, a correction was made to the Graphemere because, on very small scales (22º30 especially), the Moon showed an eternal retrograde motion.
Now, the nicest updates.
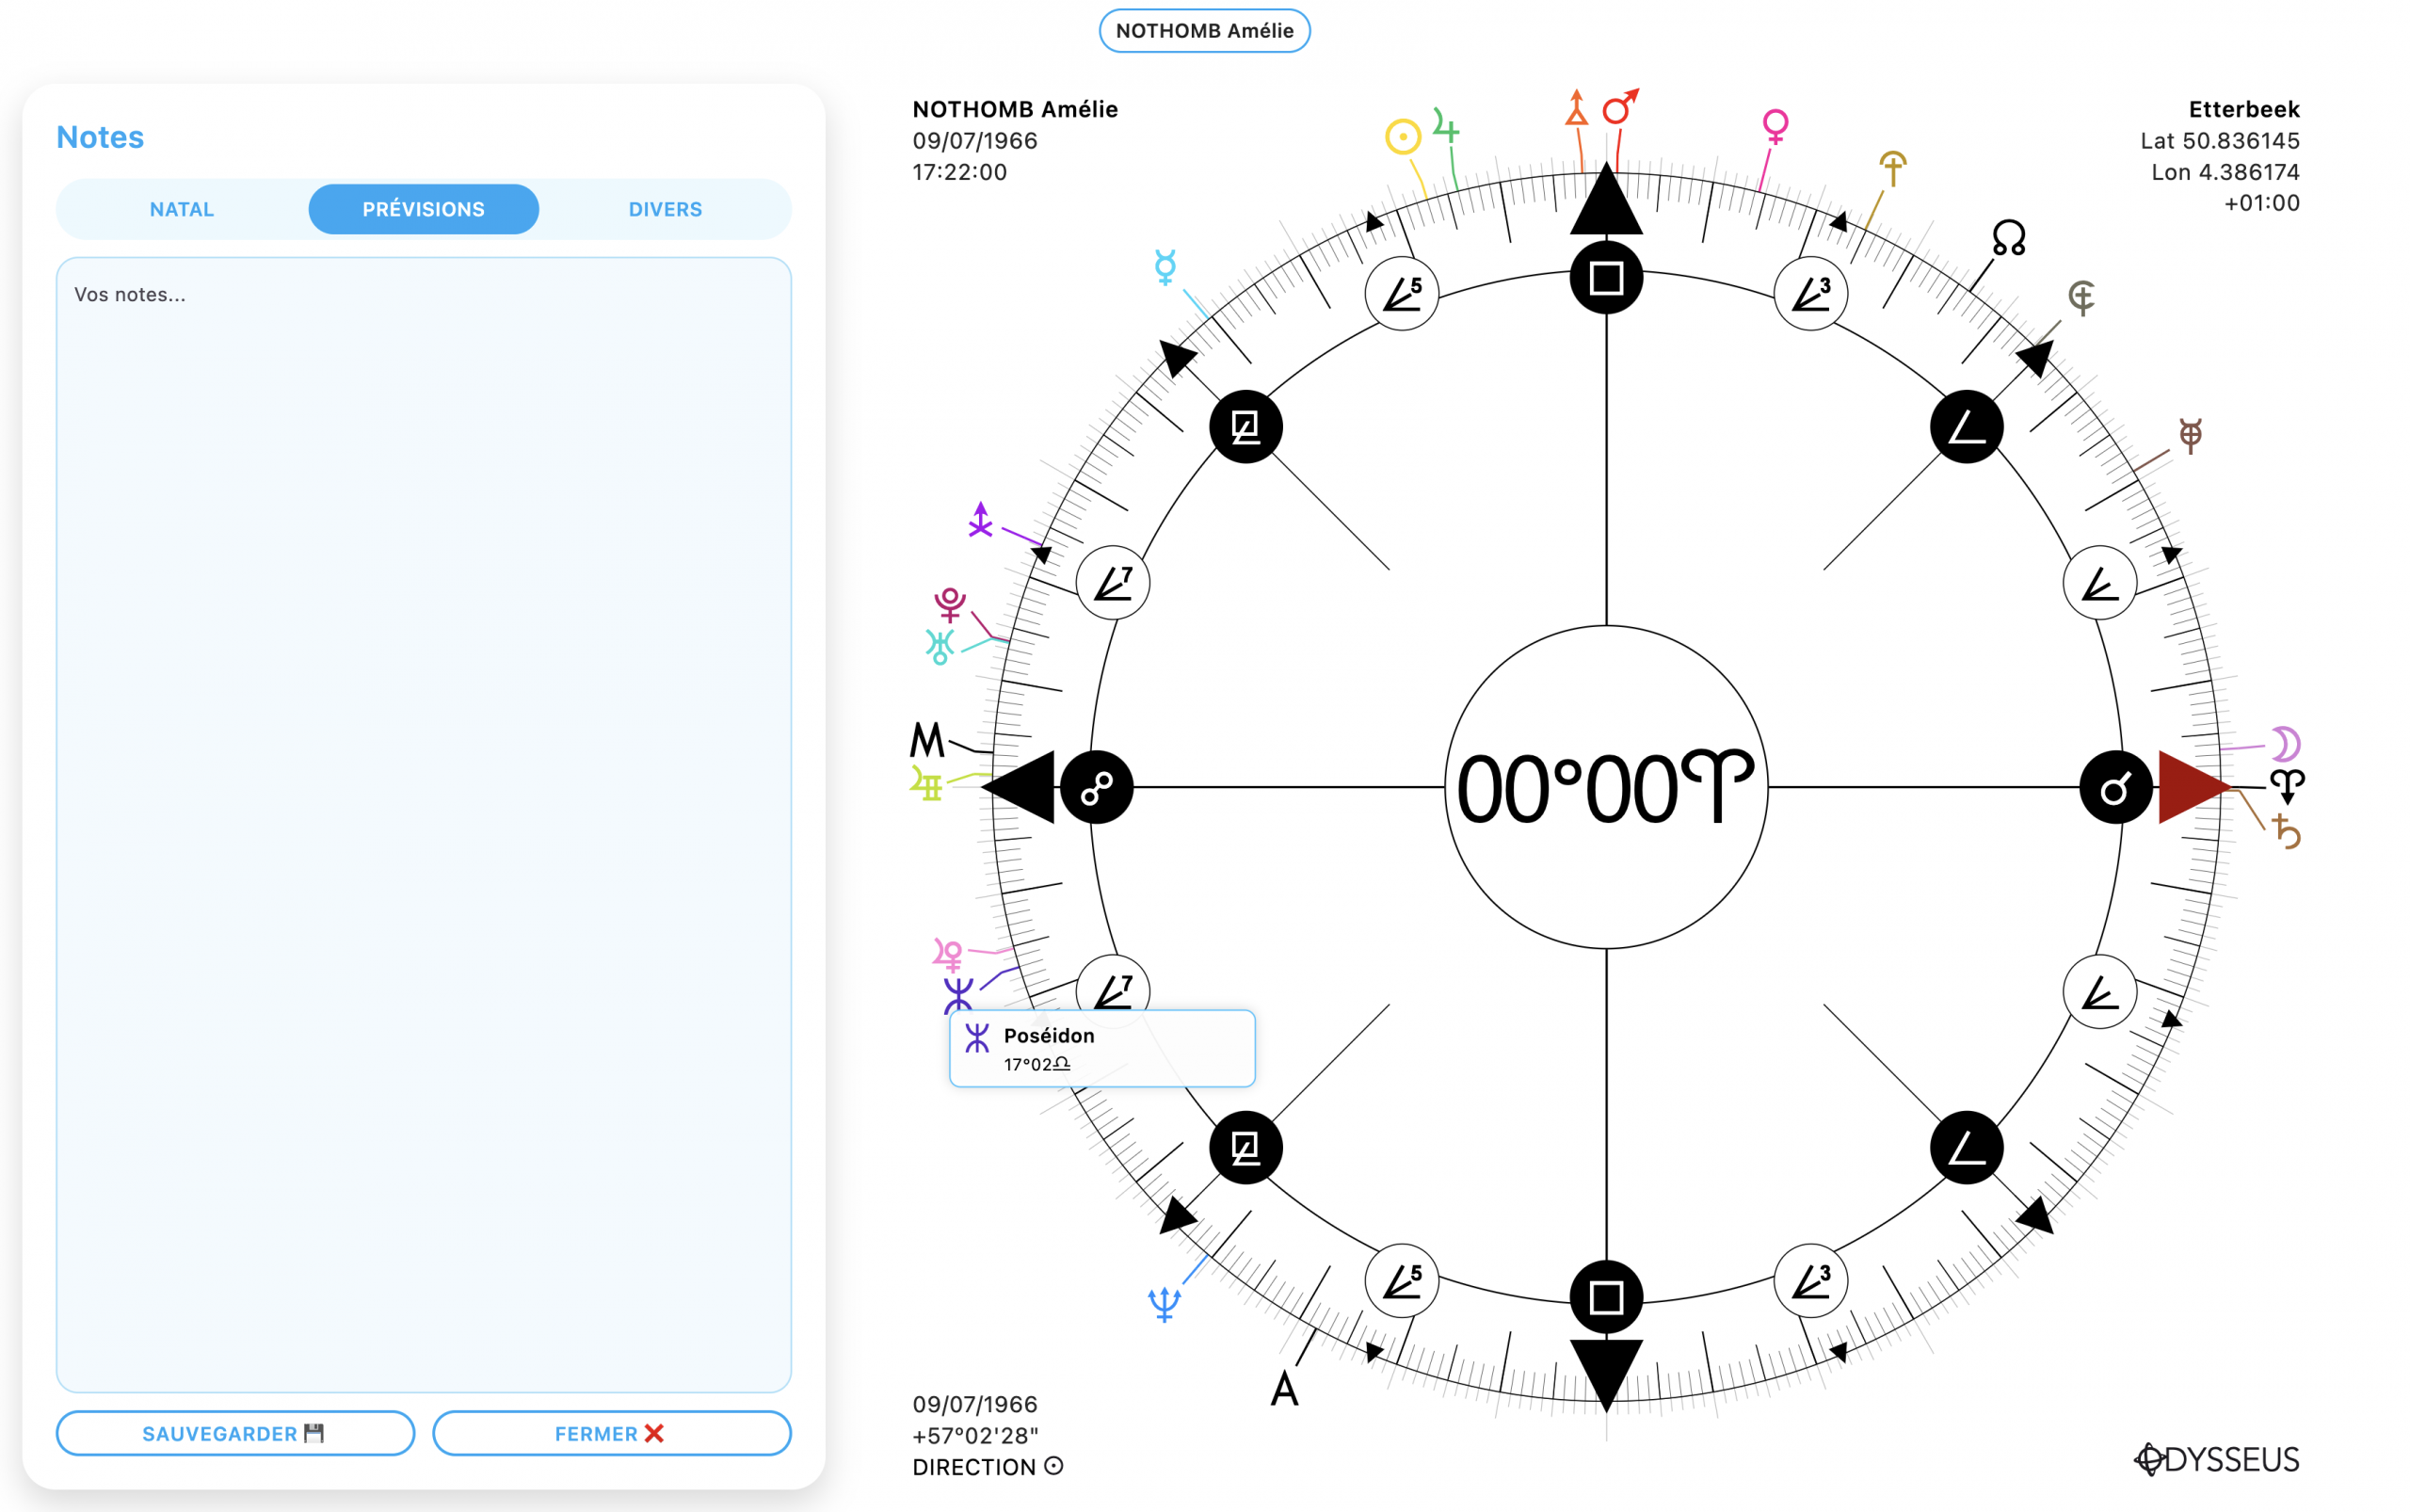
– We’ll start with the appearance of a new button: the “Notes” ❝ button. With this button, you can type your own notes in three tabs: natal, forecasts and miscellaneous. Make sure you save properly. After many difficulties and a bunch of bugs, I think we’re good and that it’s solid, but it still needs verifying.
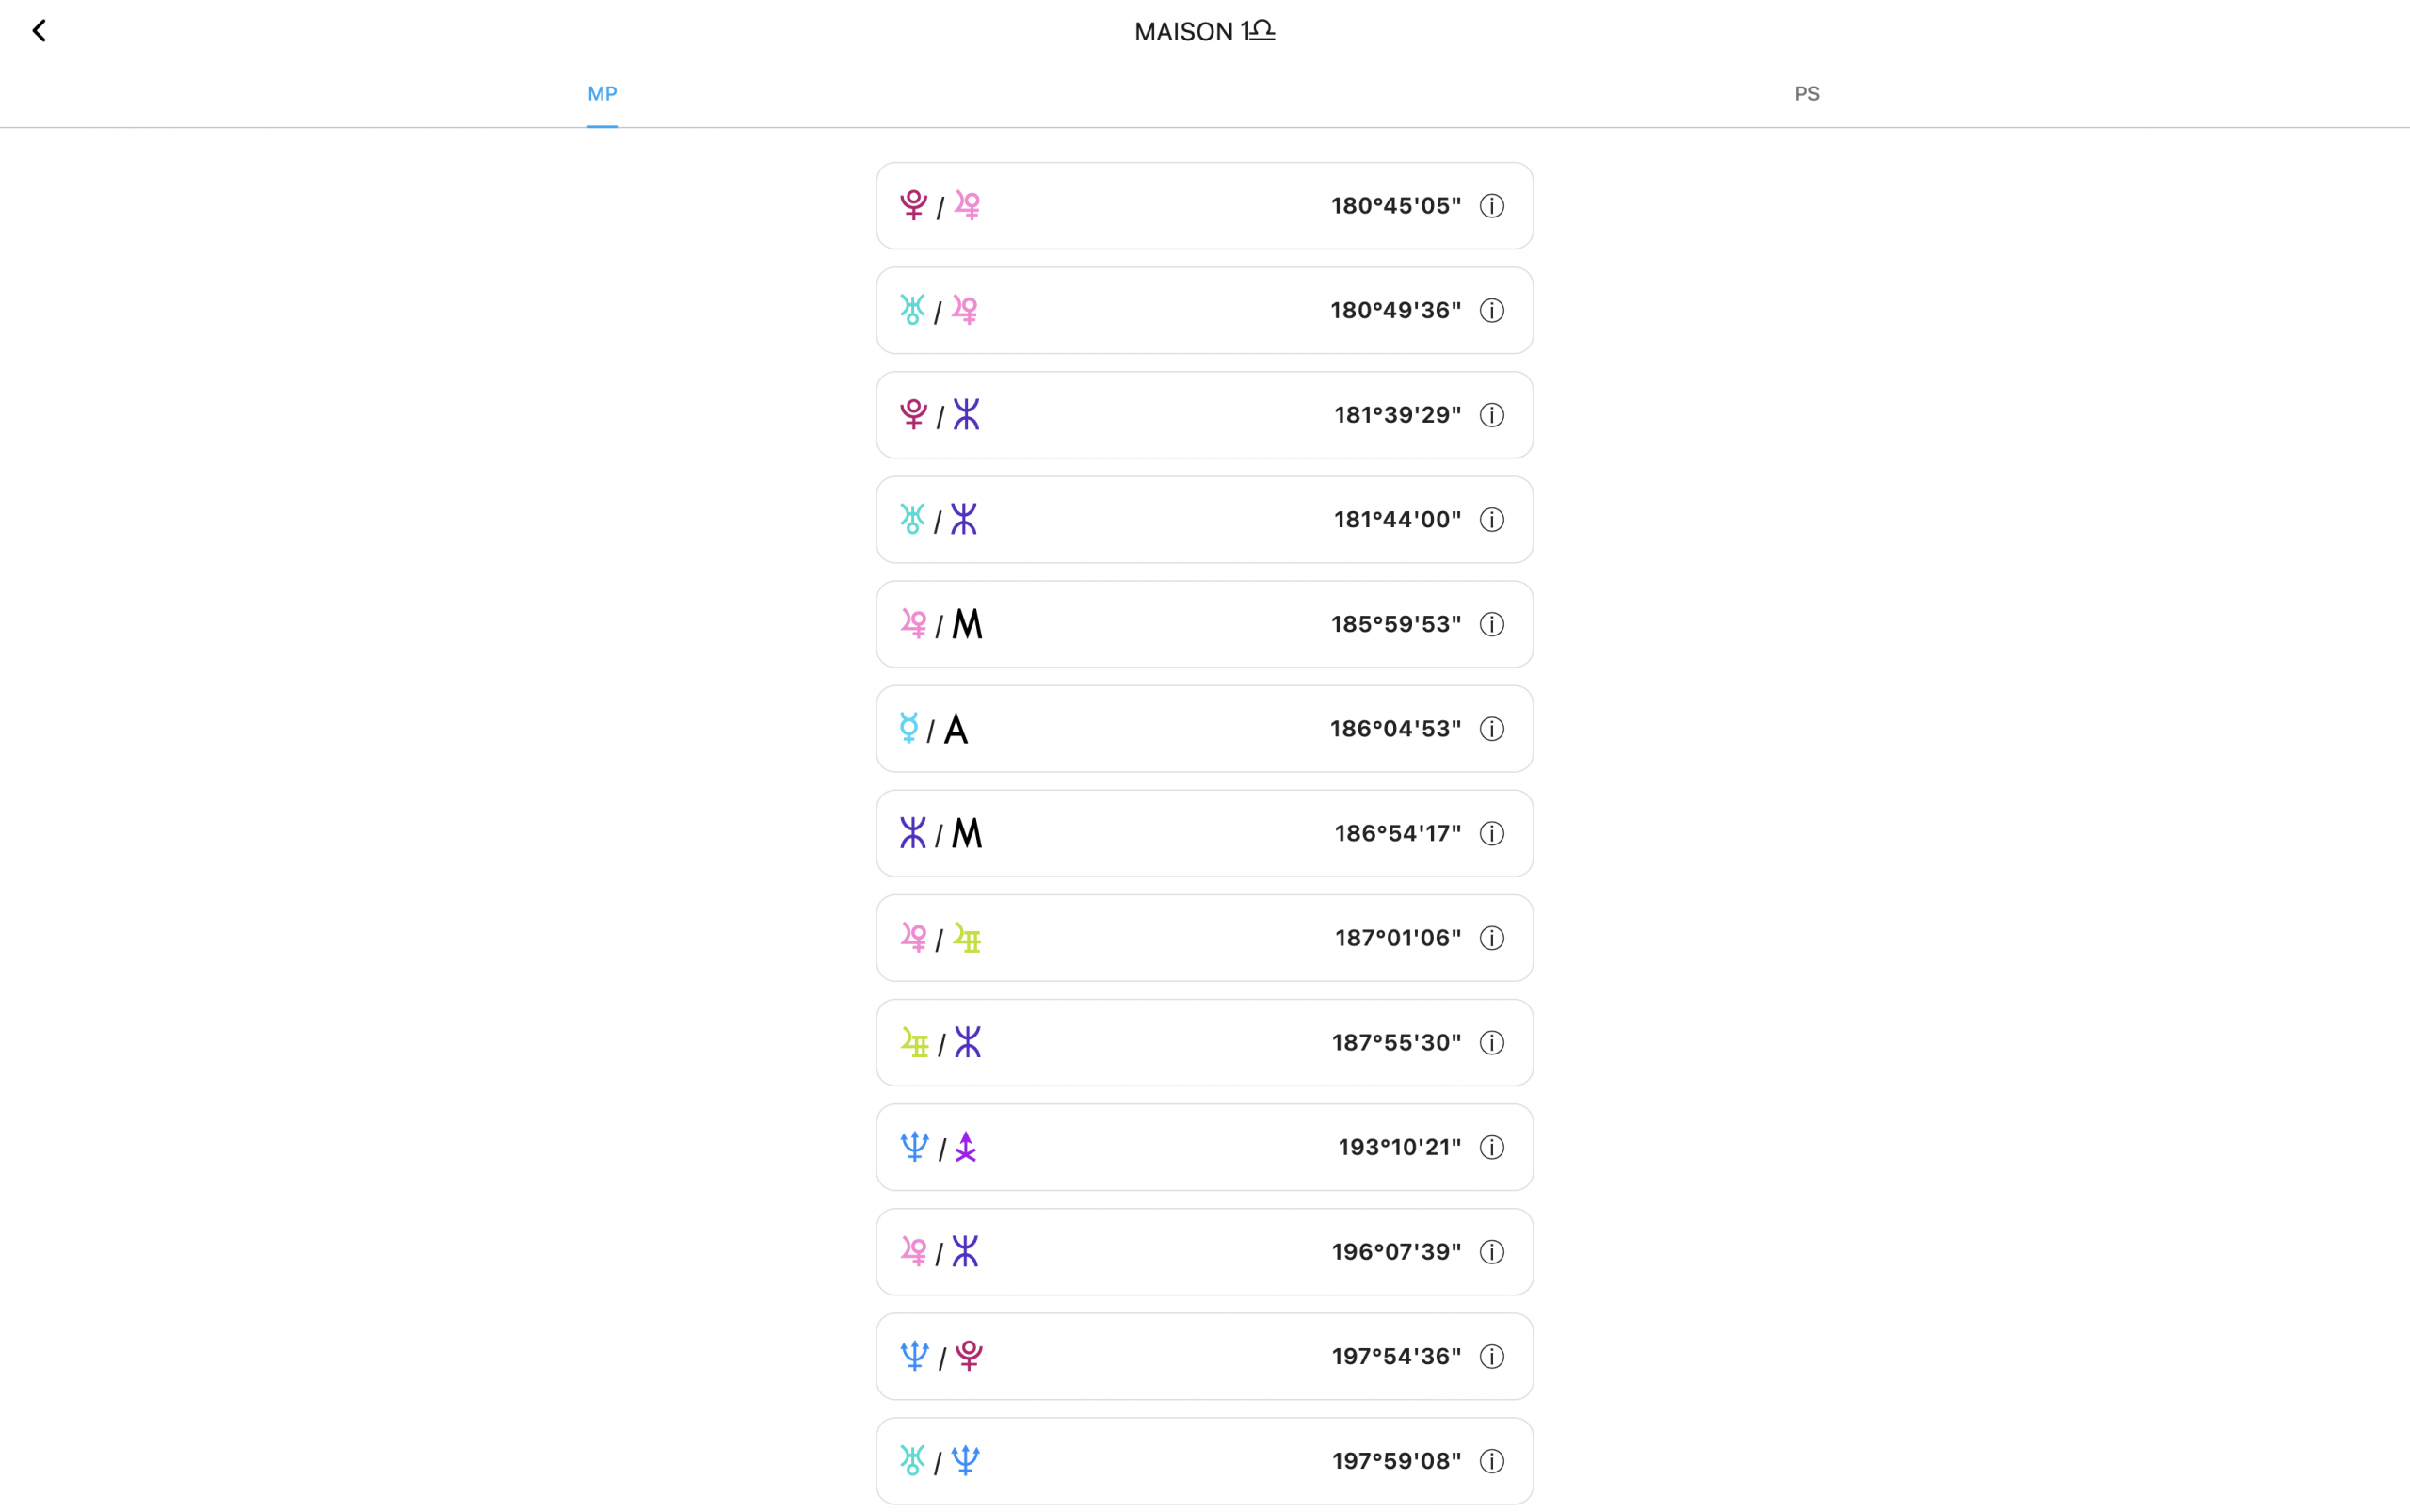
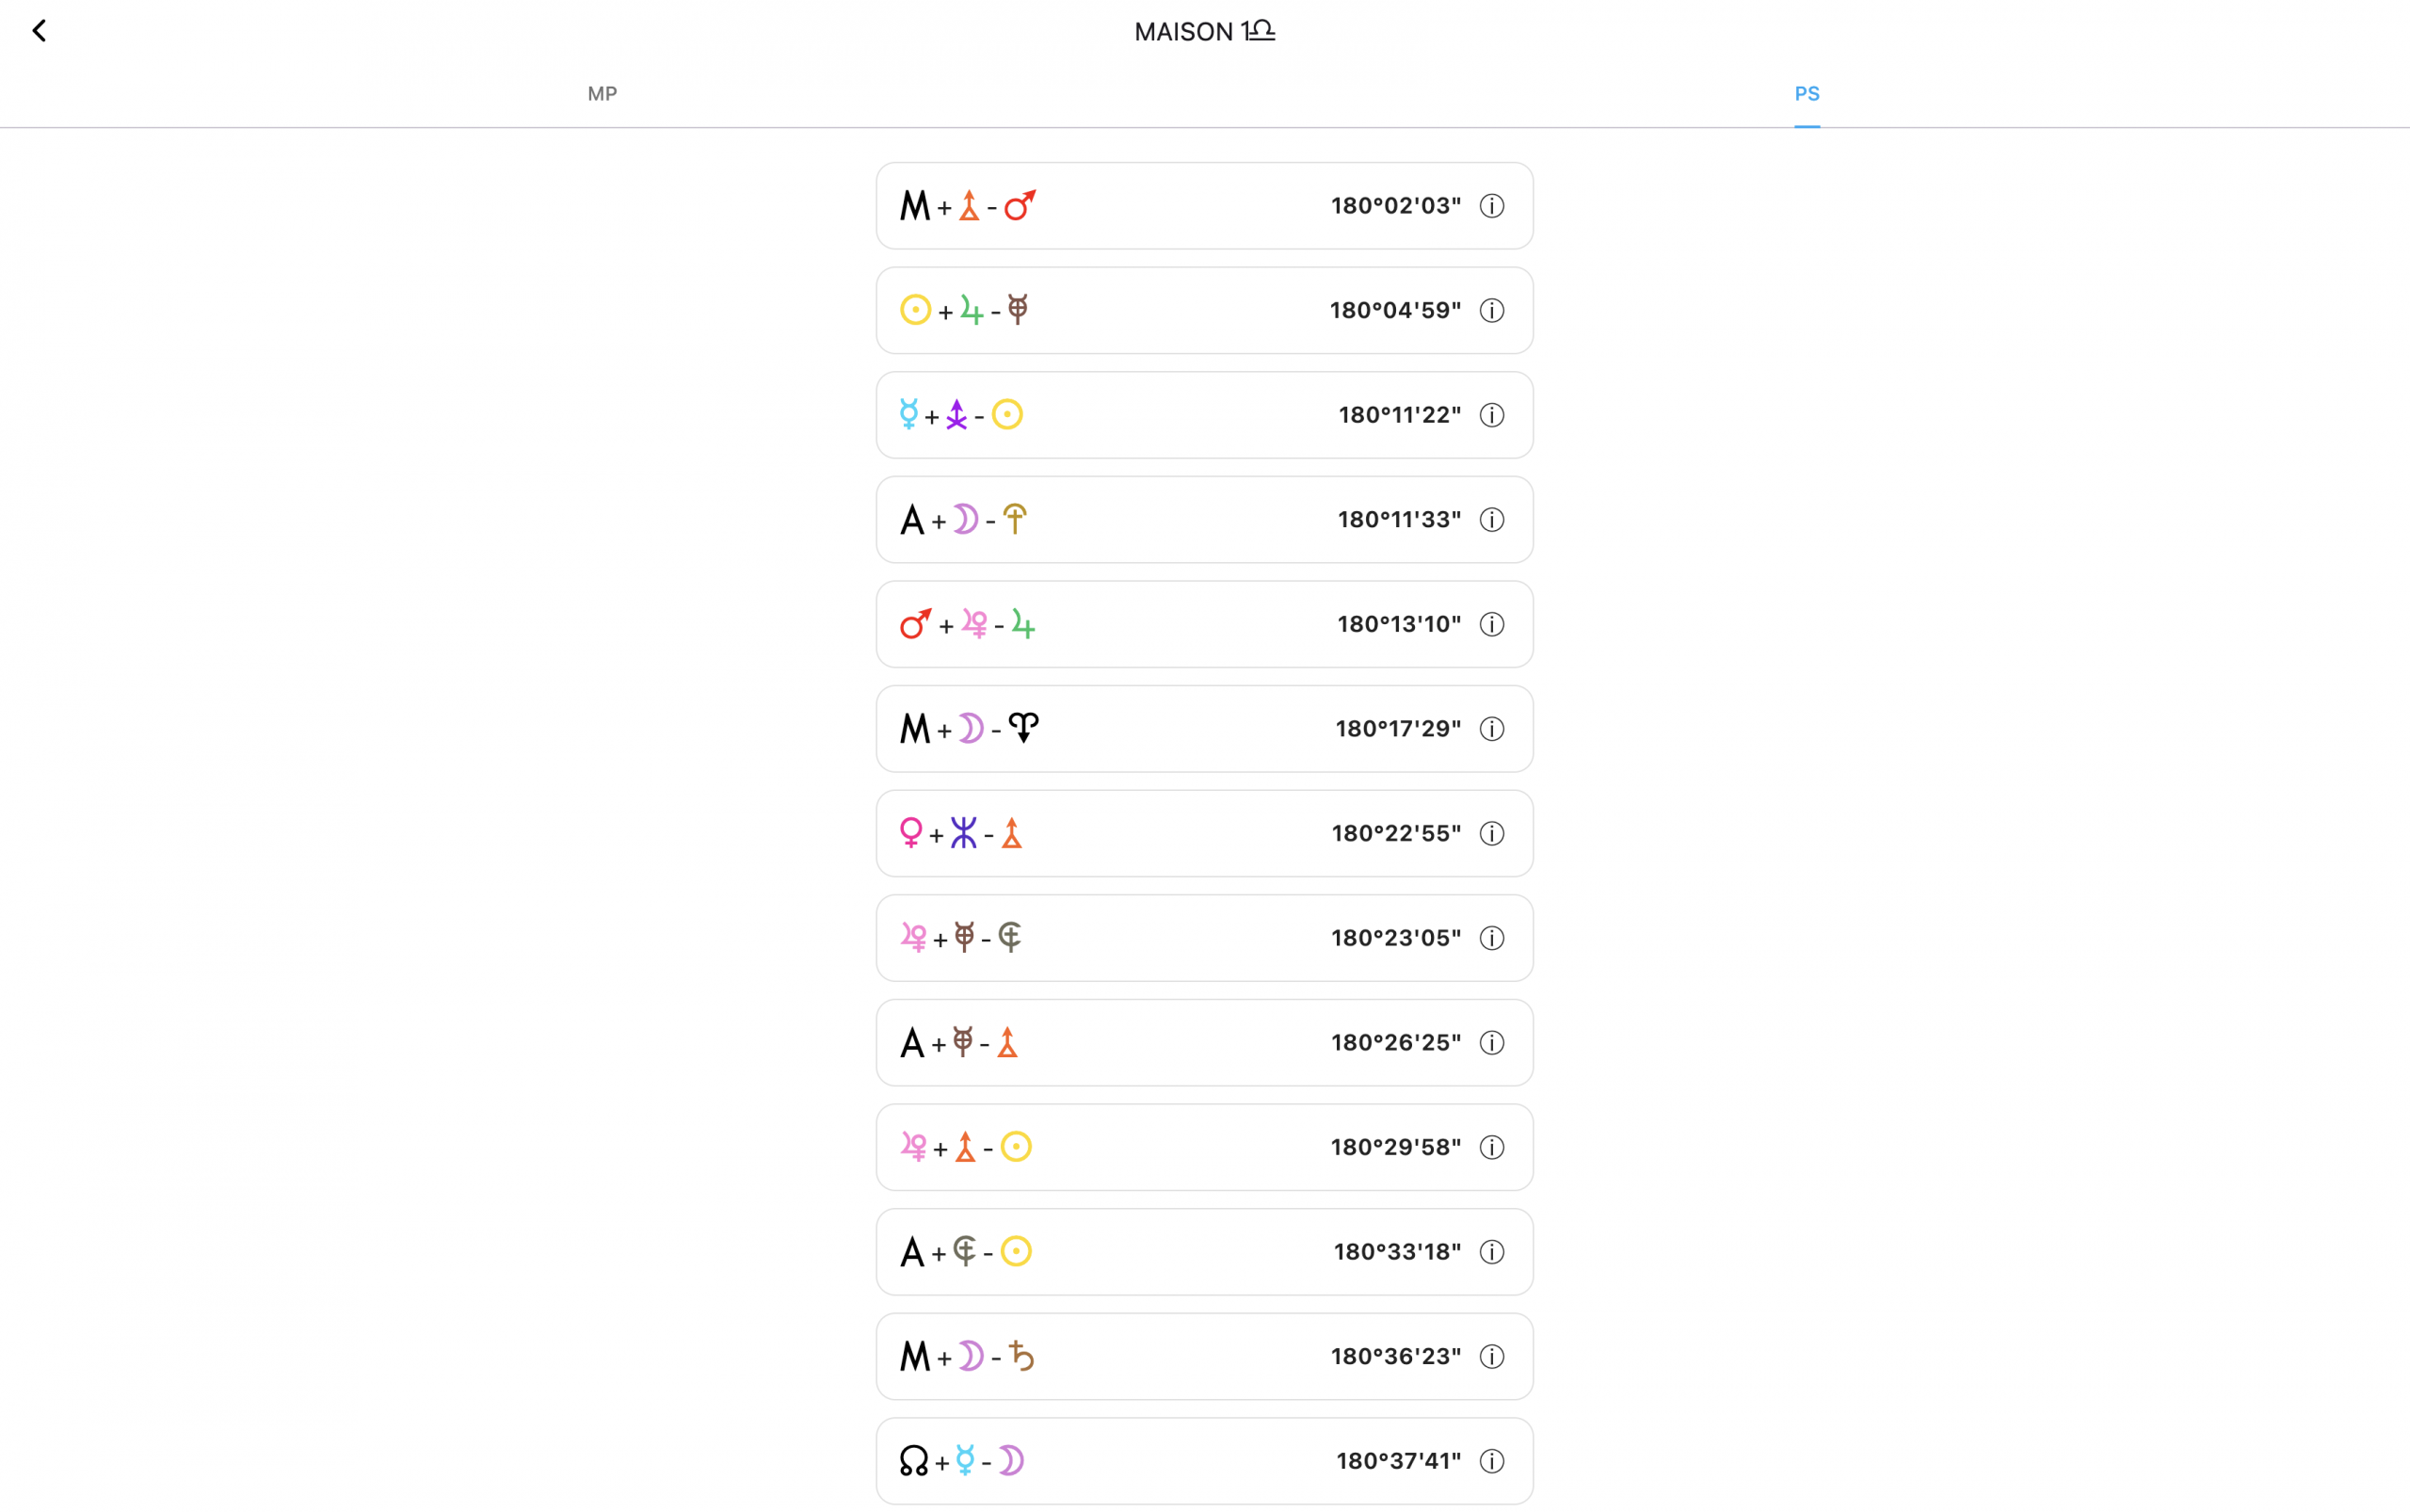
– In the Houses Table 🏠, if you now long-press/long-click on a cell, it displays a new window with two tabs showing which midpoints and sensitive points are present in the House in question. VERY handy! And each time, the definition can be consulted directly on the spot.
– Drawing mode has been improved quite a bit. It’s not perfect yet, but we’re getting close! Now, 4 modes can be switched between: line ✎, path ✑, circle ⭘, text 𝕋. To switch from one to another, just right-click on the button (yes, as a reminder, I’ll say it again: this tool is only available on Mac/Windows computers, because phones don’t allow it).
- Line mode ✎ is done from one planet to another, or by using the center of the wheel as an anchor point (a small black dot has been added)
- Path mode ✑ can be done from anywhere. For now, it’s a freehand path, but I wonder if it wouldn’t be interesting in the future to turn it into a Bézier curve or straight paths by pressing a key, for example
- Circle mode ⭘ positions the center of the circle at the pointer location. By clicking on a planet, the circle takes the planet’s color
- Text mode can be done from anywhere, but the text takes the planet’s color if you do it on a planet.
You can start drawing mode with CTRL/CMD+D or by clicking the button directly.
You can undo the last action with CTRL/CMD+Z.
You can clear everything with CTRL/CMD+E or by long-pressing on the button.
You can delete just one element by holding CTRL/CMD and moving the mouse near an element that becomes shaded, then +X.
You can move elements by holding CTRL/CMD, then click-and-hold on the element and drag.
You can edit text by holding CTRL/CMD and then single-clicking on the text.
You can change an element’s size by holding SHIFT and moving the mouse near an element that becomes shaded, then click and drag up/down (a function that doesn’t work well on Windows, because it doesn’t like the SHIFT function, so I’ll try to find something simpler in the next update).
You can make everything invisible with CTRL/CMD+F (Ghost mode).
In short, a pretty nice tool.
– Finally, and not least… the creation of a “Grimoire”. To access it, just long-click on the search button 🔎. This grimoire has a simple function: to let you type your own formulas/figures with their definition, and find them everywhere on the chart where you’ll be able to consult them (midpoints listings, planetary figures, houses, search form…)
In the Grimoire, you create a category, you can also create sub-categories, you enter your formulas and your definitions, you can move them by holding the little handle on the left ⠿, export 📤 your formulas to share them with others, but also… import 📥 them. And for the occasion, I’m offering you as an example—during these end-of-year holidays—a small group of about thirty figures talking about our end-of-year festivities and what goes with them. You can download it here, then import it into the software. And you’re all set!
And that’s all for today! But that’s already quite a lot.
If everything goes well and there aren’t any last-minute bugs I haven’t seen, there probably won’t be an update. So until the next one, I wish you excellent end-of-year holidays, a very merry Christmas, and an excellent new year 2026!