Version 7.5.0
What the radix’ going on? We jump from version 7.3 to 7.5? Yeah, well first of all, I do what I want! But it’s mostly because the kind beta-testers on Windows took care of debugging version 7.4 before it hit the stores 🙂
SO! Big update! Lots of fixes and new features. Usually, I present updates in the format: fixes, improvements, new features. But here, since a lot of things were done, I prefer to go “section by section”.
+ First of all, what can’t really be illustrated but will be noticed: more than 150 new definitions have entered the Codex. Among them, a few rare shy little additions about asteroids (it’s a start).
+ Also, in the texts for the Houses of the Sun, emojis were added at the beginning of sections for a nicer reading experience. In the long run I’d like to rewrite all my House texts to make them more concise, but I admit I’m sorely lacking time.
+ Next, two improvements in the saved charts manager. First, it is now possible to export charts in bulk in a .zip format, but also to import a compressed pack of charts, also in .zip format. So if you want to share a large number of charts with each other, it will be much simpler.
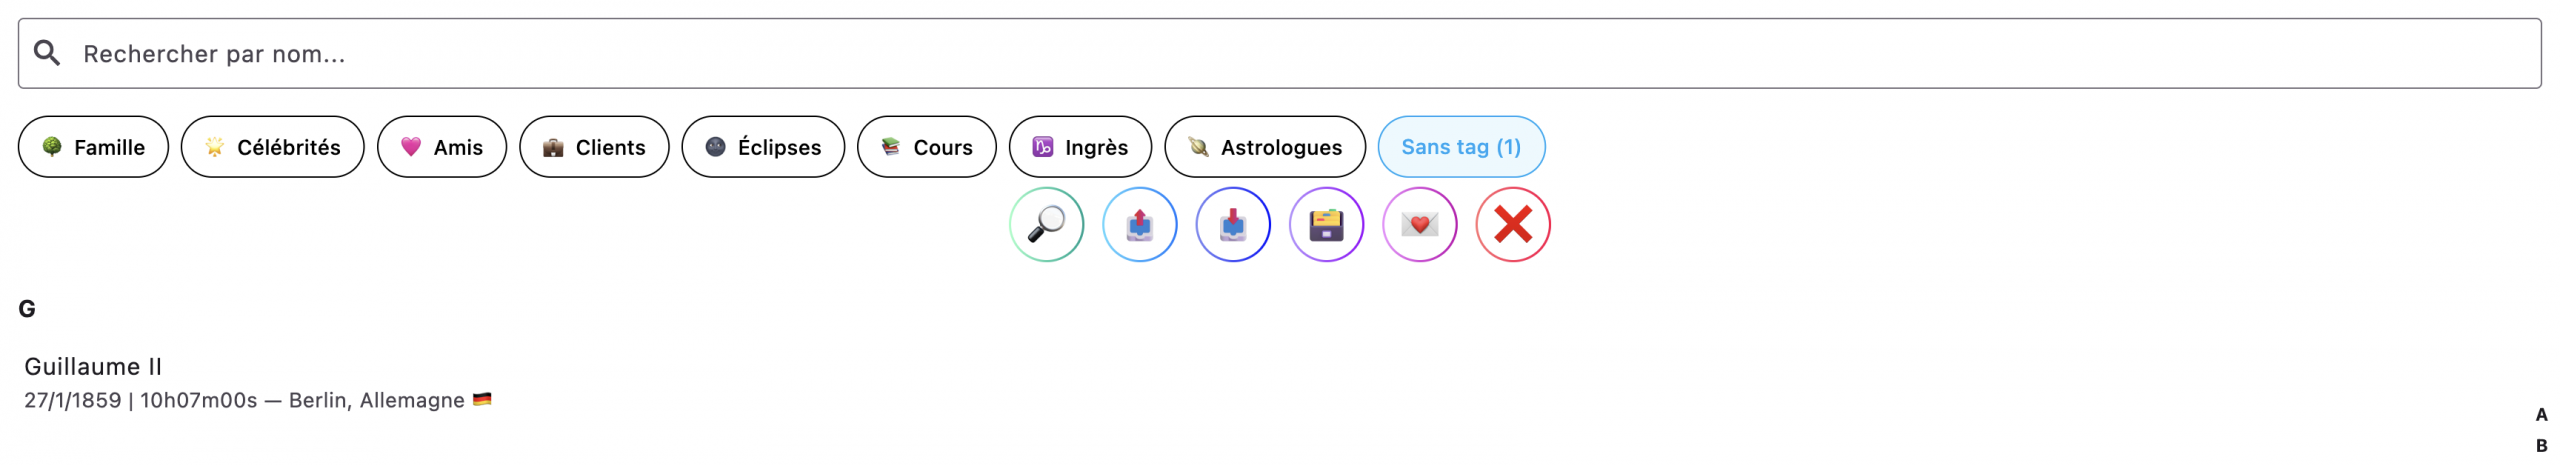
+ And second, you know it’s possible to give a “tag”, a “category” to charts. But it can happen that we forget to tag one. It will then appear in the tag list as “without tag”. And it will then be easy to spot those that should be.
+ By the way, about tags/categories: the chart creation page used to remember the last opened chart even when closing and reopening the app, but it would forget the tag (which, in itself, wasn’t a big deal because it was still always saved, but it could lead to handling errors). That’s fixed. BY THE WAY! I insist! When you give a category to your chart, SAVE THE CHANGE AFTERWARDS WITH THE 💾 BUTTON, otherwise it won’t be kept in memory!
+ On the chart creation page, I changed the ⏰ emoji to a 🫧 emoji, adding a tooltip explaining that this button is used to start over with a new chart, cleanly:
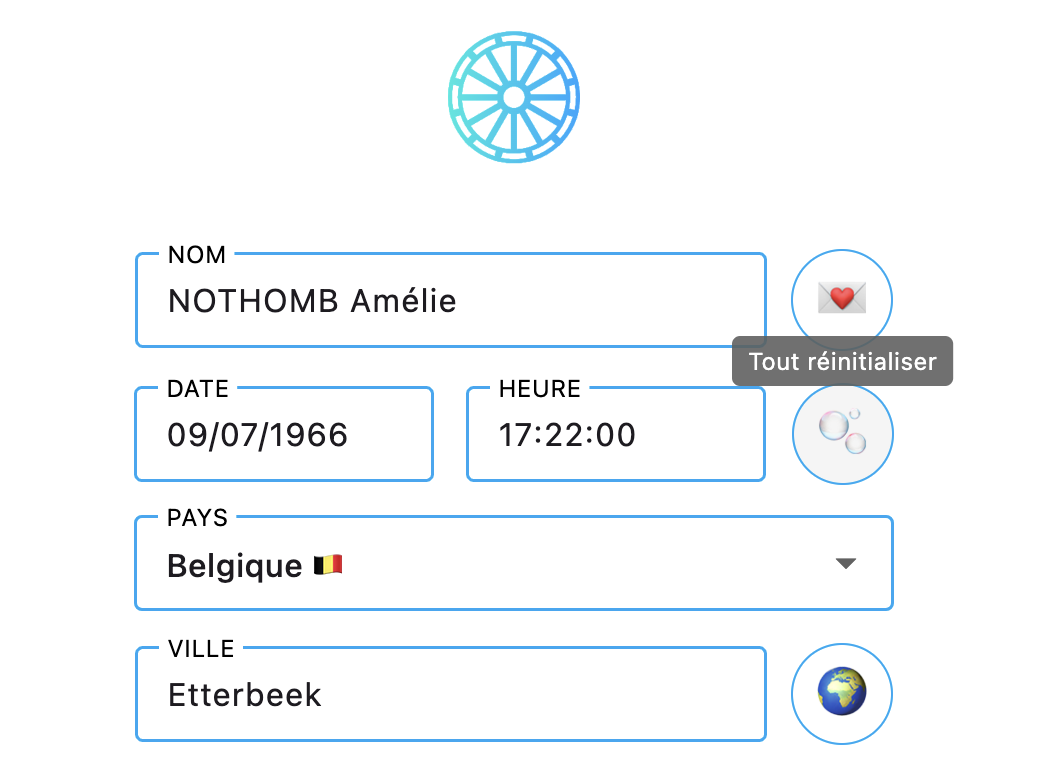
Because, unfortunately, its role as a full reset had gone a bit unnoticed for some users who thought that, to start from scratch, they had to delete everything by hand. Not only is that not the case, but it wouldn’t have been effective either. Because if you just opened a chart in which you typed notes with the ❝ tab, then by going back to the creation page and deleting everything by hand to create a new chart, that chart would have inherited those ❝ notes. Whereas by clicking 🫧, you start again on a blank page!
+ Still on the chart creation page, now for US cities, the state will be specified. I also modified the city list to increase it considerably (we nearly tripled the number of cities).
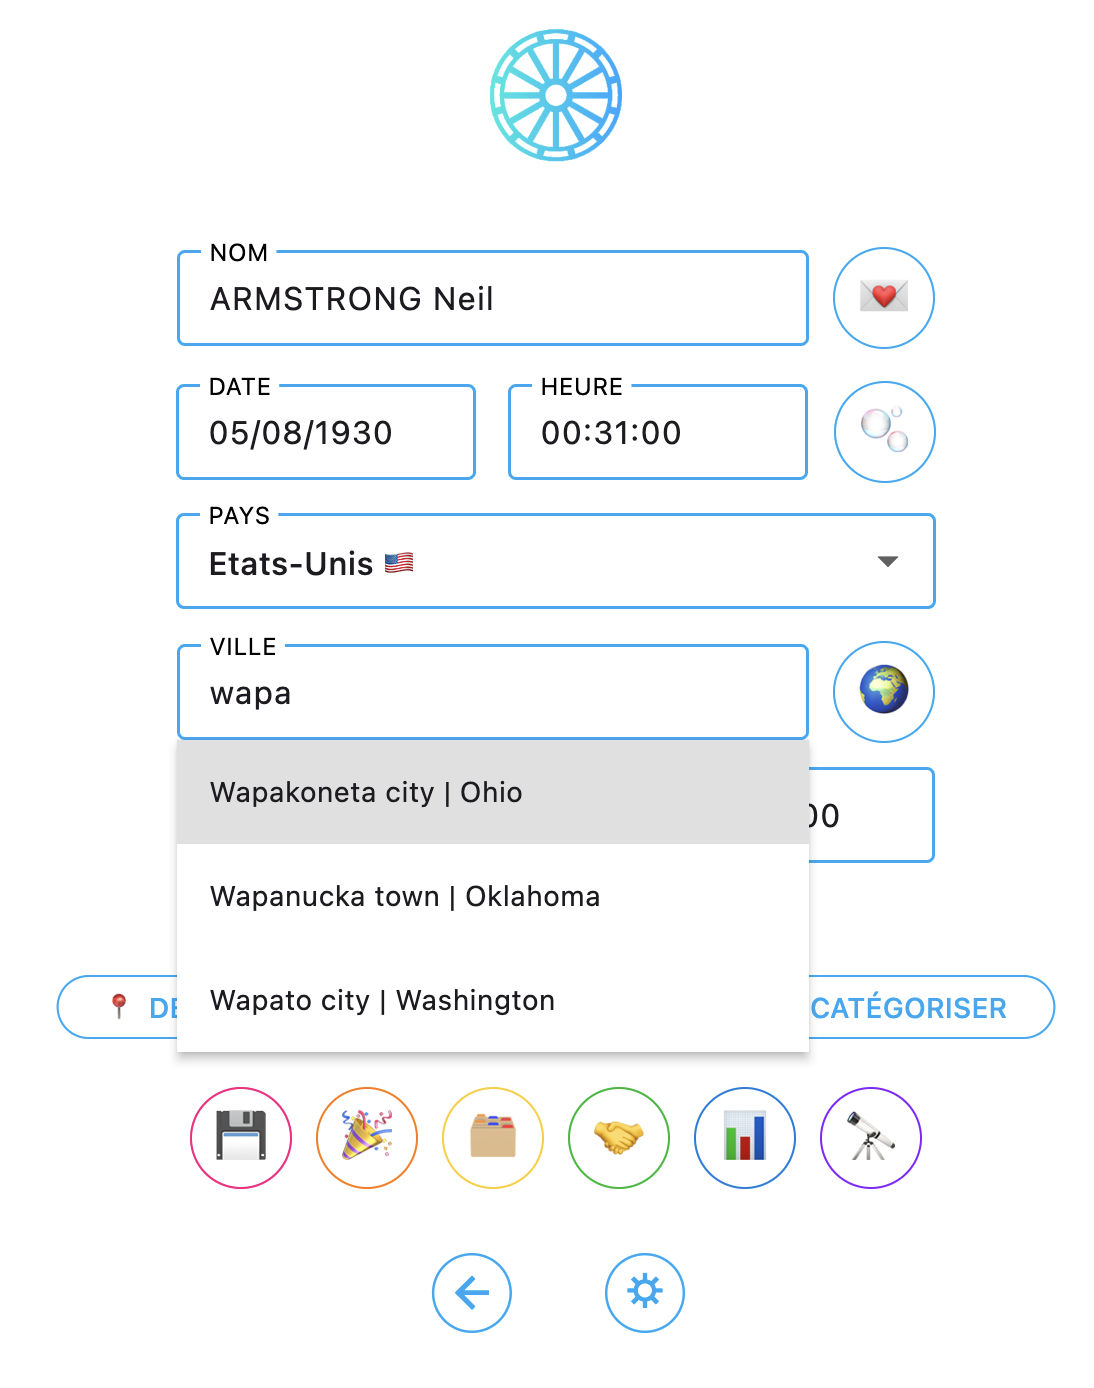
+ And along the same line, the longitude, latitude, and time offset fields have been added:
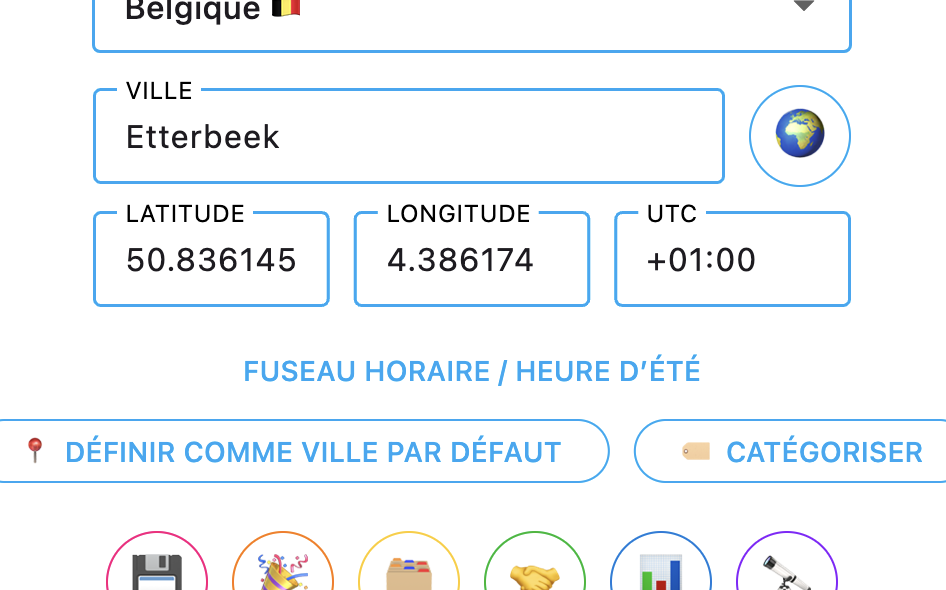
They are editable, but above all they are essential and come with a TIME ZONE/DAYLIGHT SAVING TIME button that will give you more information because… let’s be very honest: since the app exists, I’ve been literally racking my brain, week after week, implementing the time verification system, information about special time regimes around the world, consulting books, encyclopedias, websites, and many different sources but, but, but… the world being the world, you learn by doing this that there is no rule and that within the same country, the same state, and sometimes the same city, it’s possible to find different time regimes! It is therefore ESSENTIAL — and I urge you to be extremely cautious about this! — to cross-check research, sources, and testimonies to be sure of the time zones adopted for the charts you build, especially for those dating from before the 1970s for the majority of countries. In this update I added more than fifty special regimes, but I know I still haven’t covered everything. My advice, do with it what you will: ask ChatGPT. “For such a date, such a time, in such a city in such a country, what was the time offset?” and it will find sources to support the subject. You can also consult other astrology websites that can confirm or cast doubt on what you think you know about the time of the chart in question. You can then write to me to tell me that one of the time zones is miscalculated so that I can correct it. I will never be able to guarantee a 100% reliable source because nobody can. And what I can assure you from my own practice is that all astrology software on the market today that I have been able to test (a pretty good bunch…) all contain errors. Even specialized books on the subject sometimes contradict each other. So: caution, distrust, and always a counter-check. Whether for birth times, but also for transit times.
+ On the city search page by geolocation, the length of the suggestions list is both longer and scrollable, and its colors have also been revised for the Dark version because it was very hard to read.
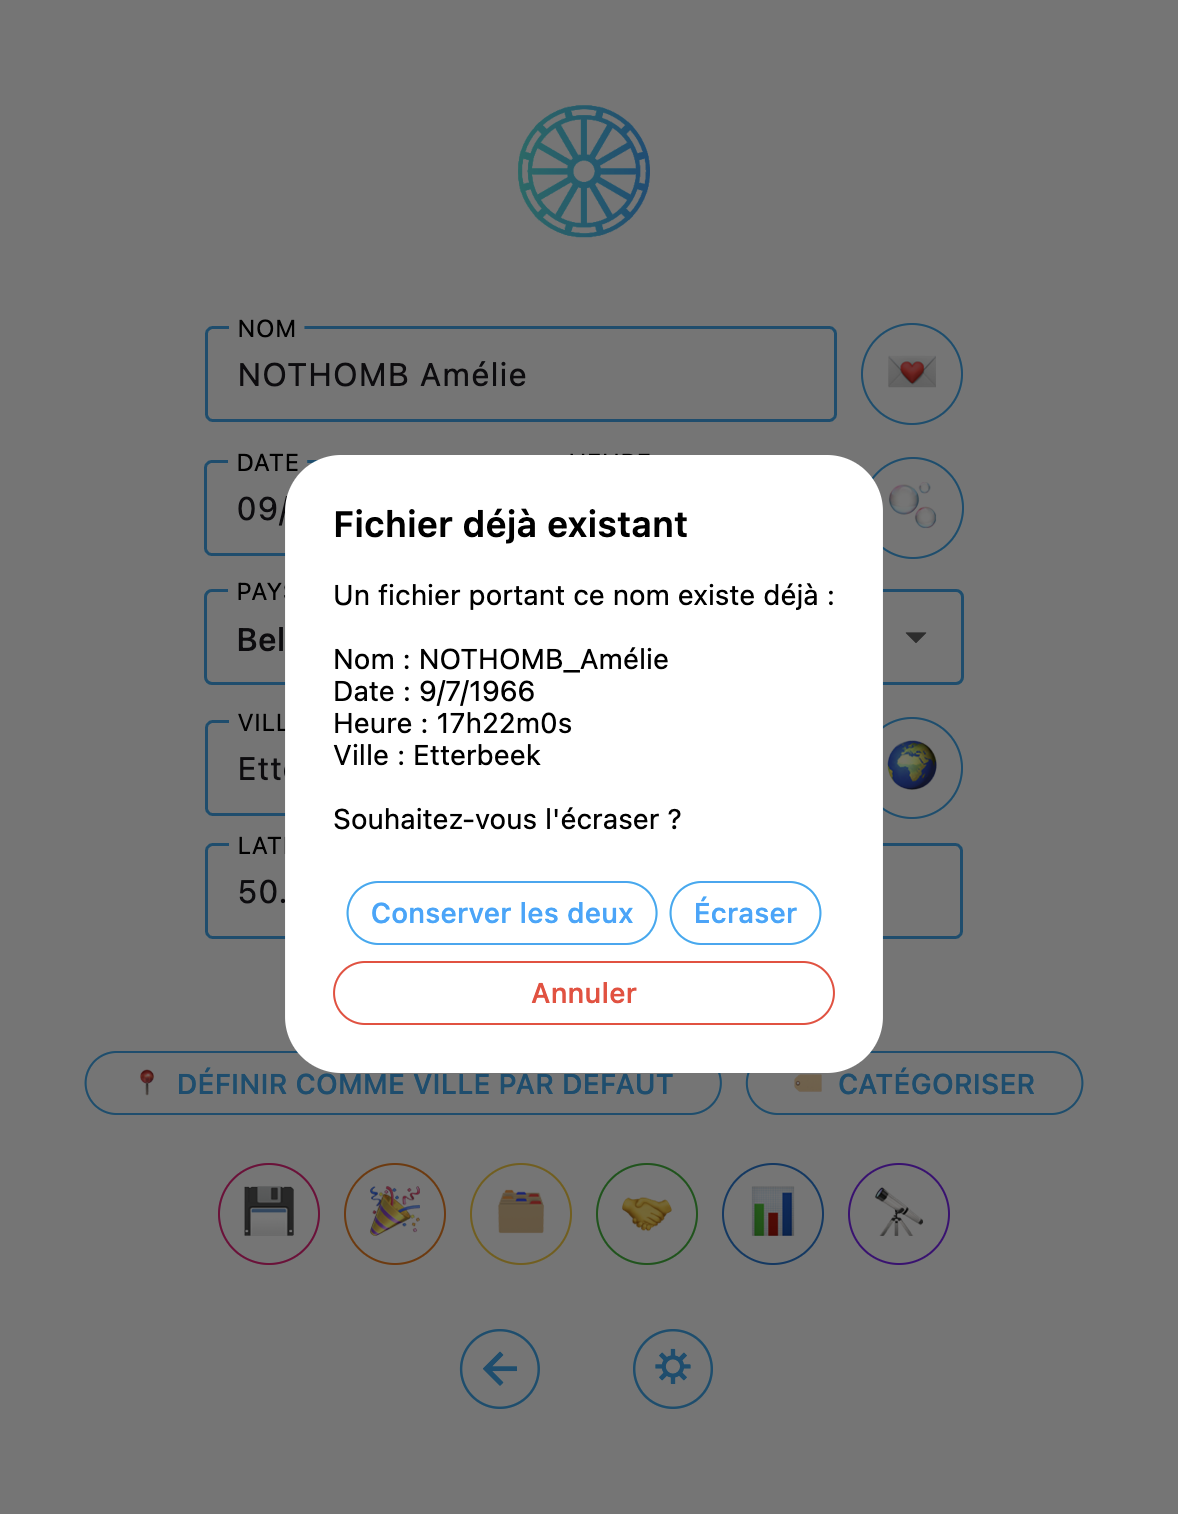
+ Finally, still on the same page, when you want to save the same chart again because you made changes for example, the popup that appears still offers to overwrite or keep both, but now also to cancel the save request.
+ Small change on desktop: when you reduced the window to the point where its layout returned to portrait format, the wheel overflowed onto the natal/direction/transit slider at the top. That’s no longer the case.
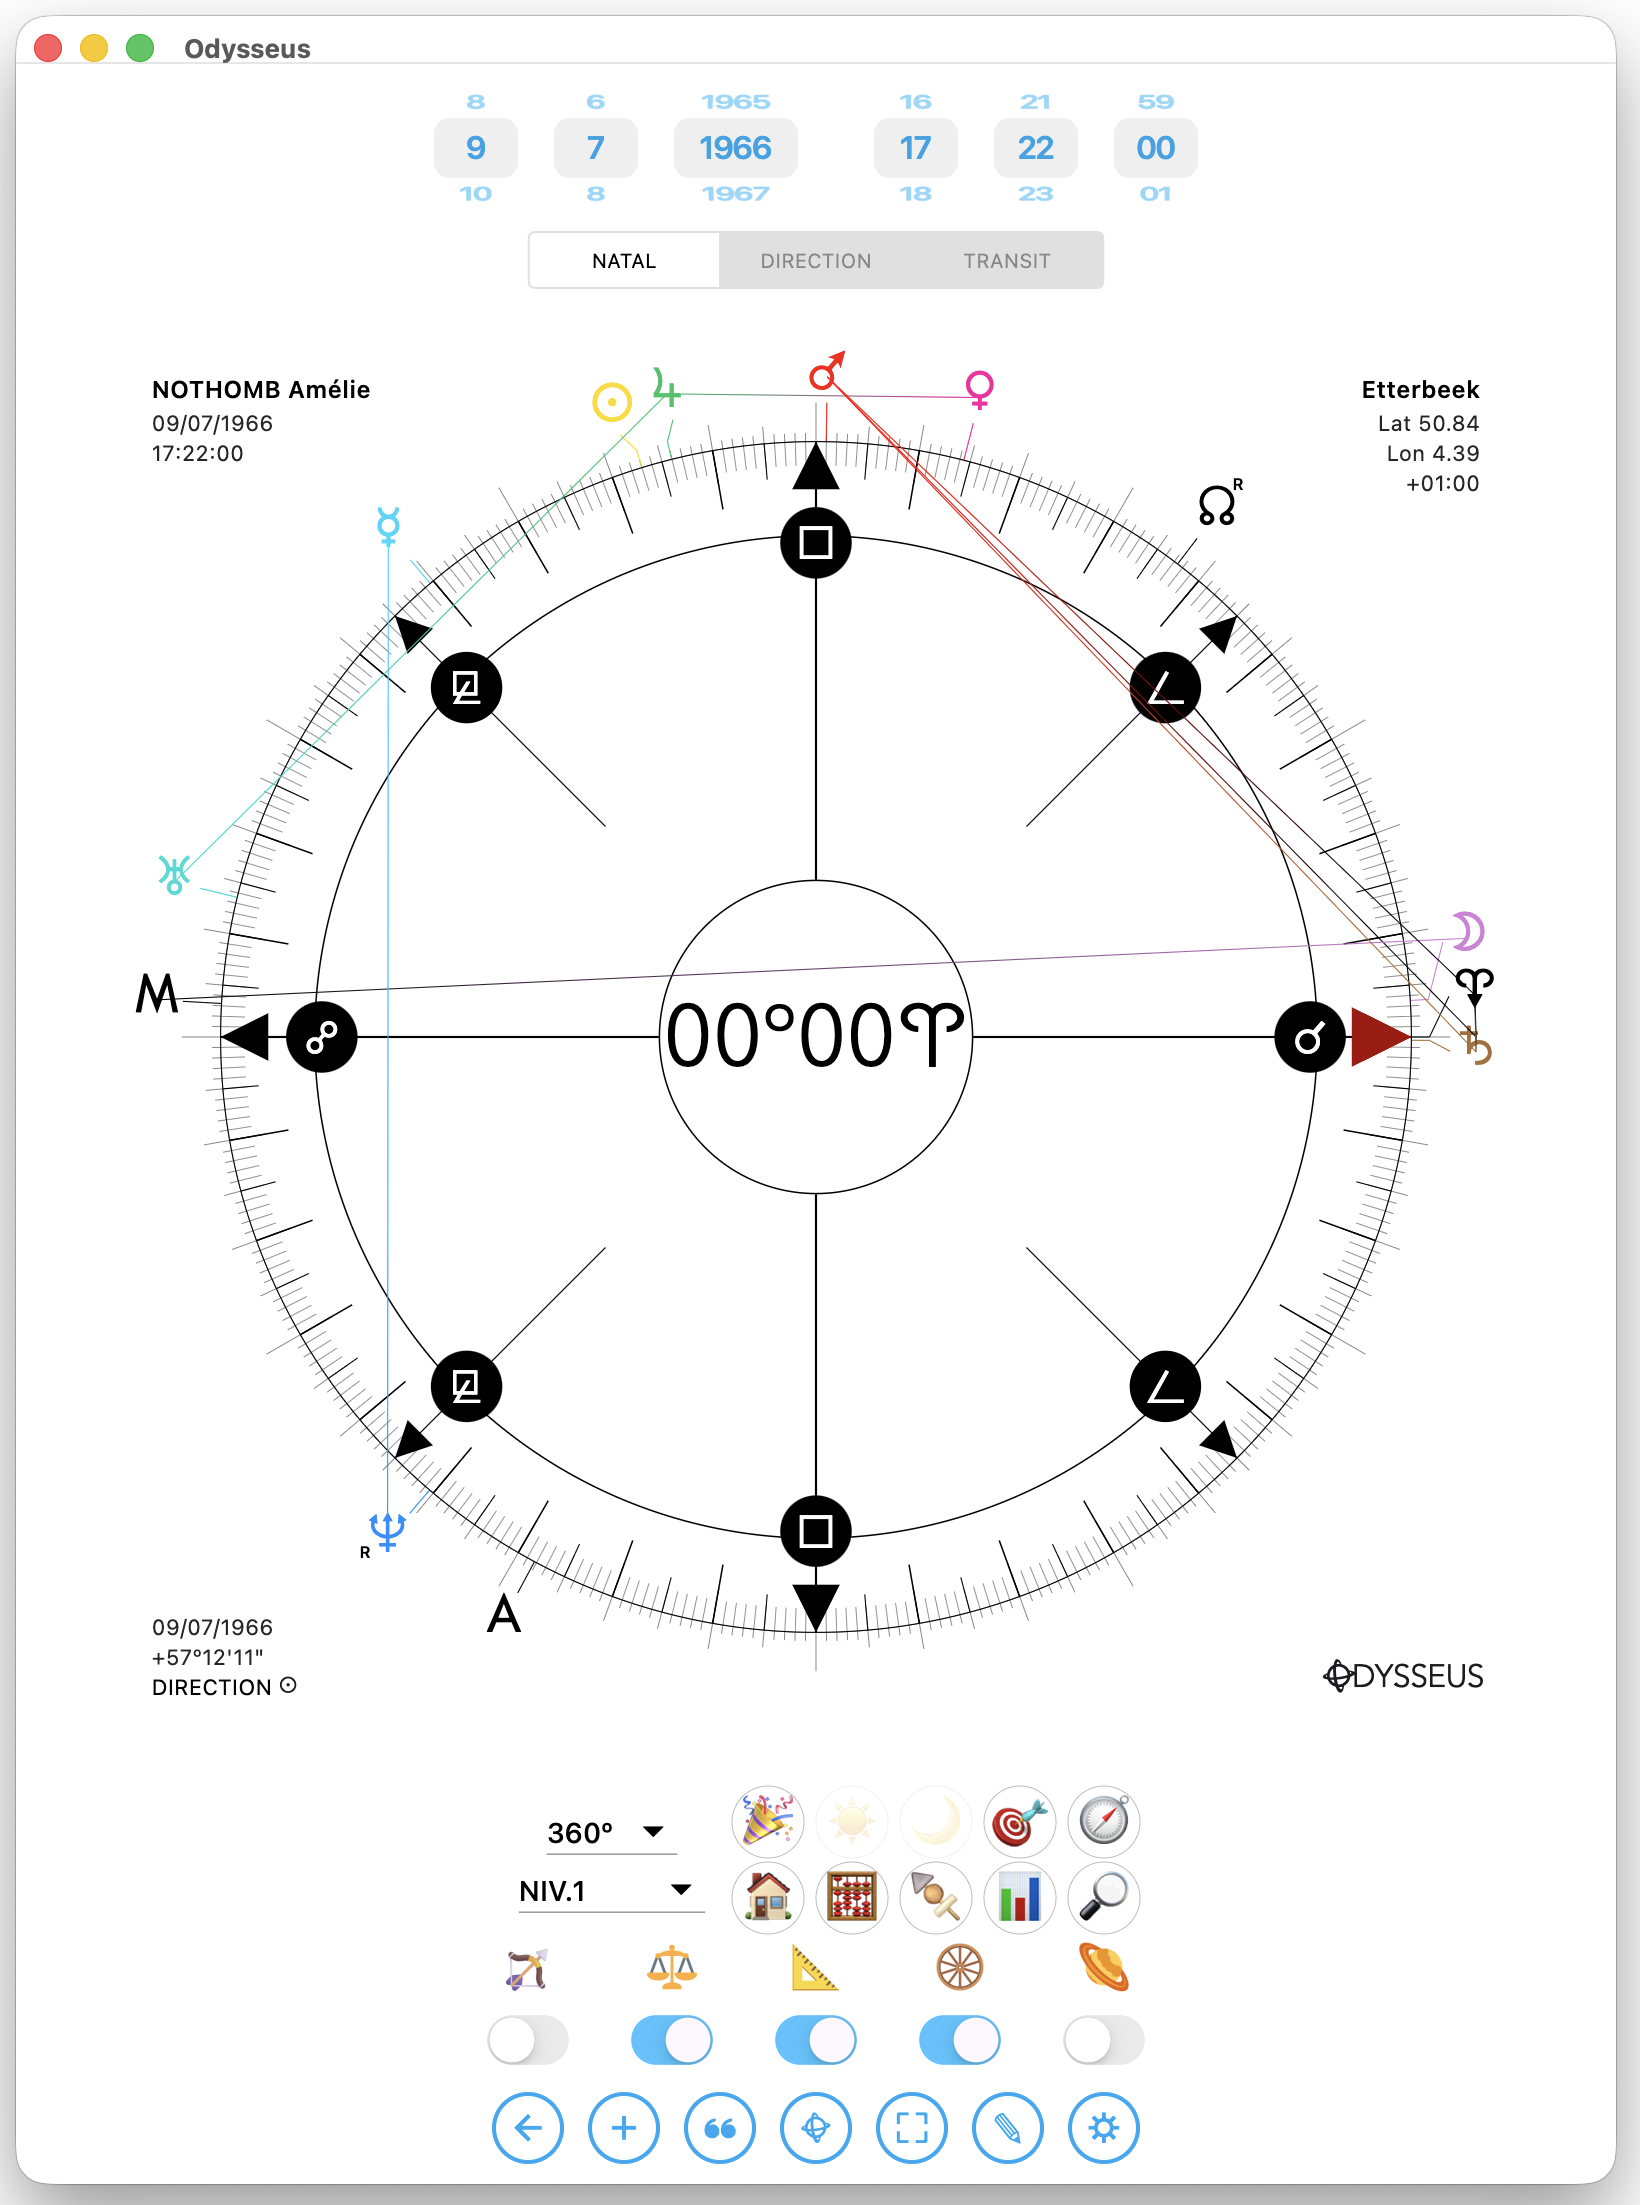
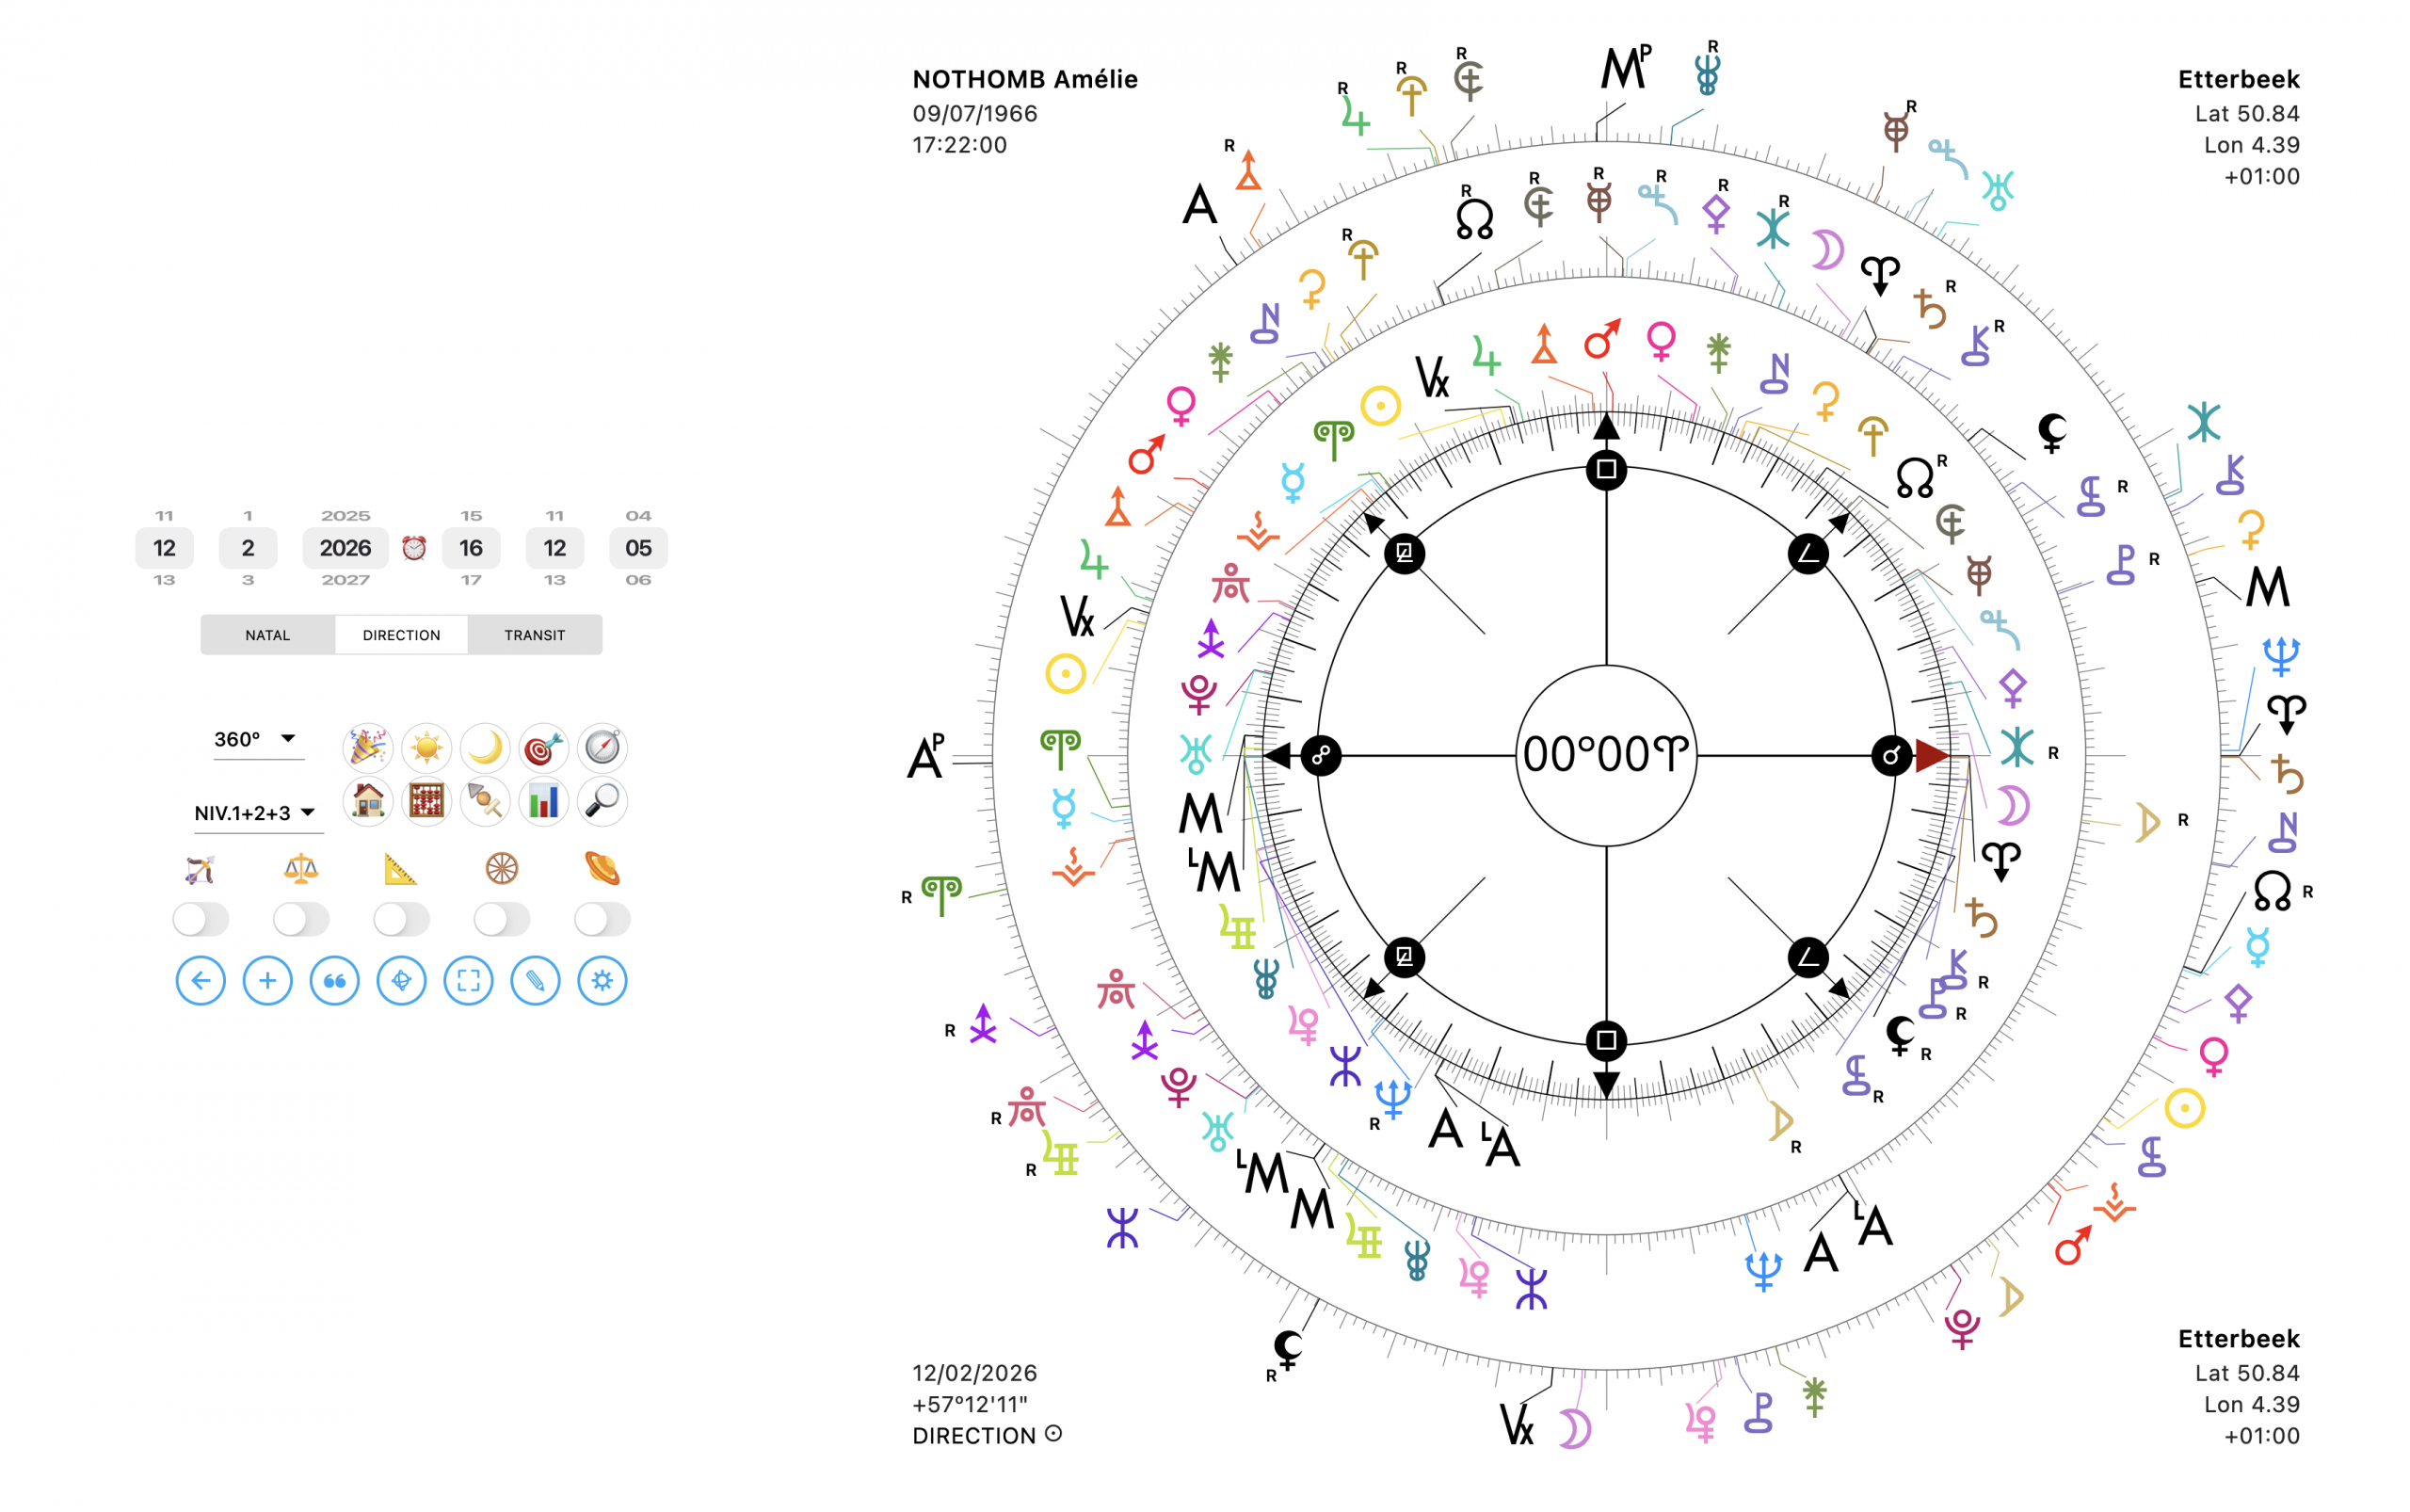
+ Also, the collision manager has been completely redone to optimize the placement of planets on the wheel as best as possible to prevent them from stepping on each other. But don’t be too greedy. On the one hand, it is totally useless and counterproductive to display ten thousand planets on a wheel, “less is more” as they say; and on the other hand, you won’t find any software that displays a very large number of bodies nicely and effectively. So either be more moderate on the subject, or get into the habit of reducing the size of the planets if you absolutely need them but they overlap:
For now, the result works not too badly. I’m not entirely satisfied, but given my current knowledge, I wouldn’t know how to do better.
+ Next, a few assorted fixes: the long press on ![]() no longer displayed all angles on harmonic wheels. That’s fixed.
no longer displayed all angles on harmonic wheels. That’s fixed.
+ The 360º wheel in Cusp mode ![]() rotated to cusp 10 when you clicked a custom point instead of cusp 4. That’s fixed too.
rotated to cusp 10 when you clicked a custom point instead of cusp 4. That’s fixed too.
+ And still on custom points, when you left the mouse over them, the info in the tooltip was not correct.
+ Finally, still on the tooltip, the planet coordinates did not always display correctly in the case of crossed levels (we’ll talk about that). That’s fixed too.
+ Three additions to the tooltips, precisely:
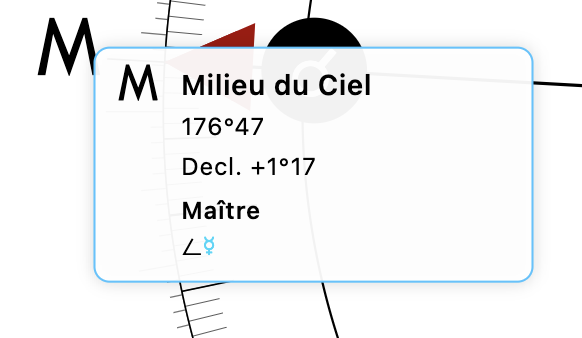
First, they now display the ruler for each point in the sky. This is a typical Witte practice: the ruler is the planet forming the “cross or half-cross” angle (meaning, by one of the following angles: j k l m n) with the body in question, with the tightest orb, closest to 0º. So this will only interest followers of Witte’s primary theories. But also:
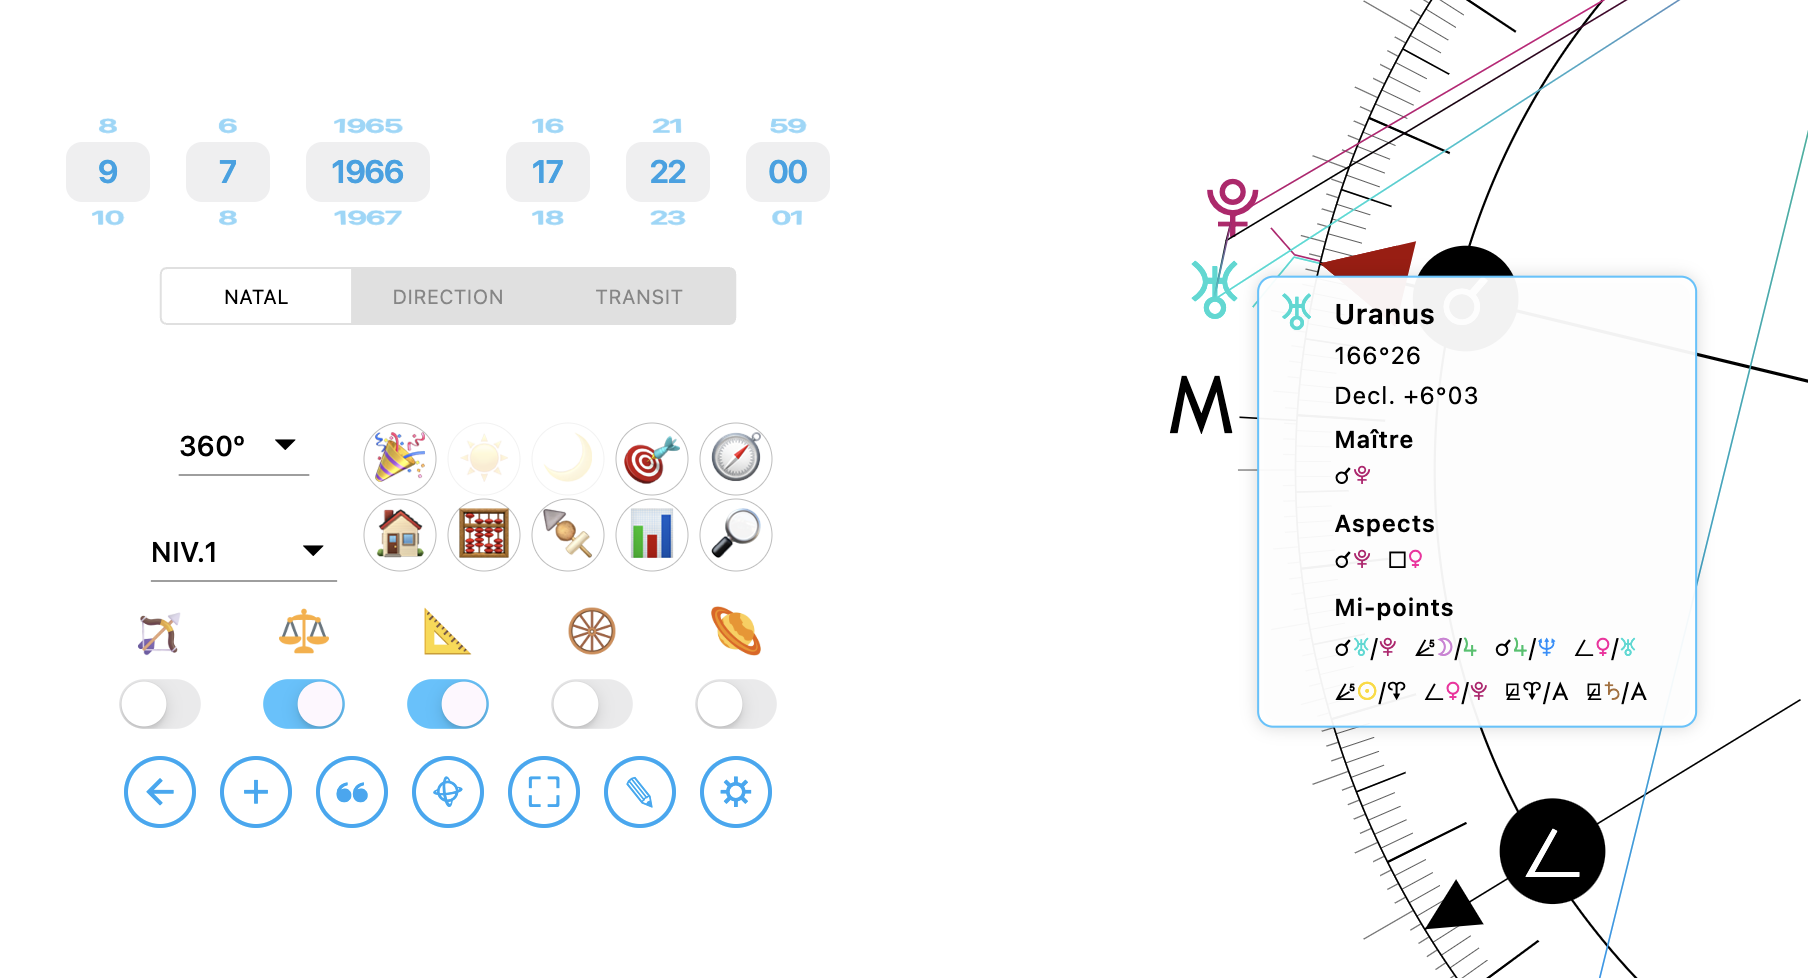
When the midpoint toggles ![]() and aspects
and aspects ![]() are enabled, we display them in the tooltip as well!
are enabled, we display them in the tooltip as well!
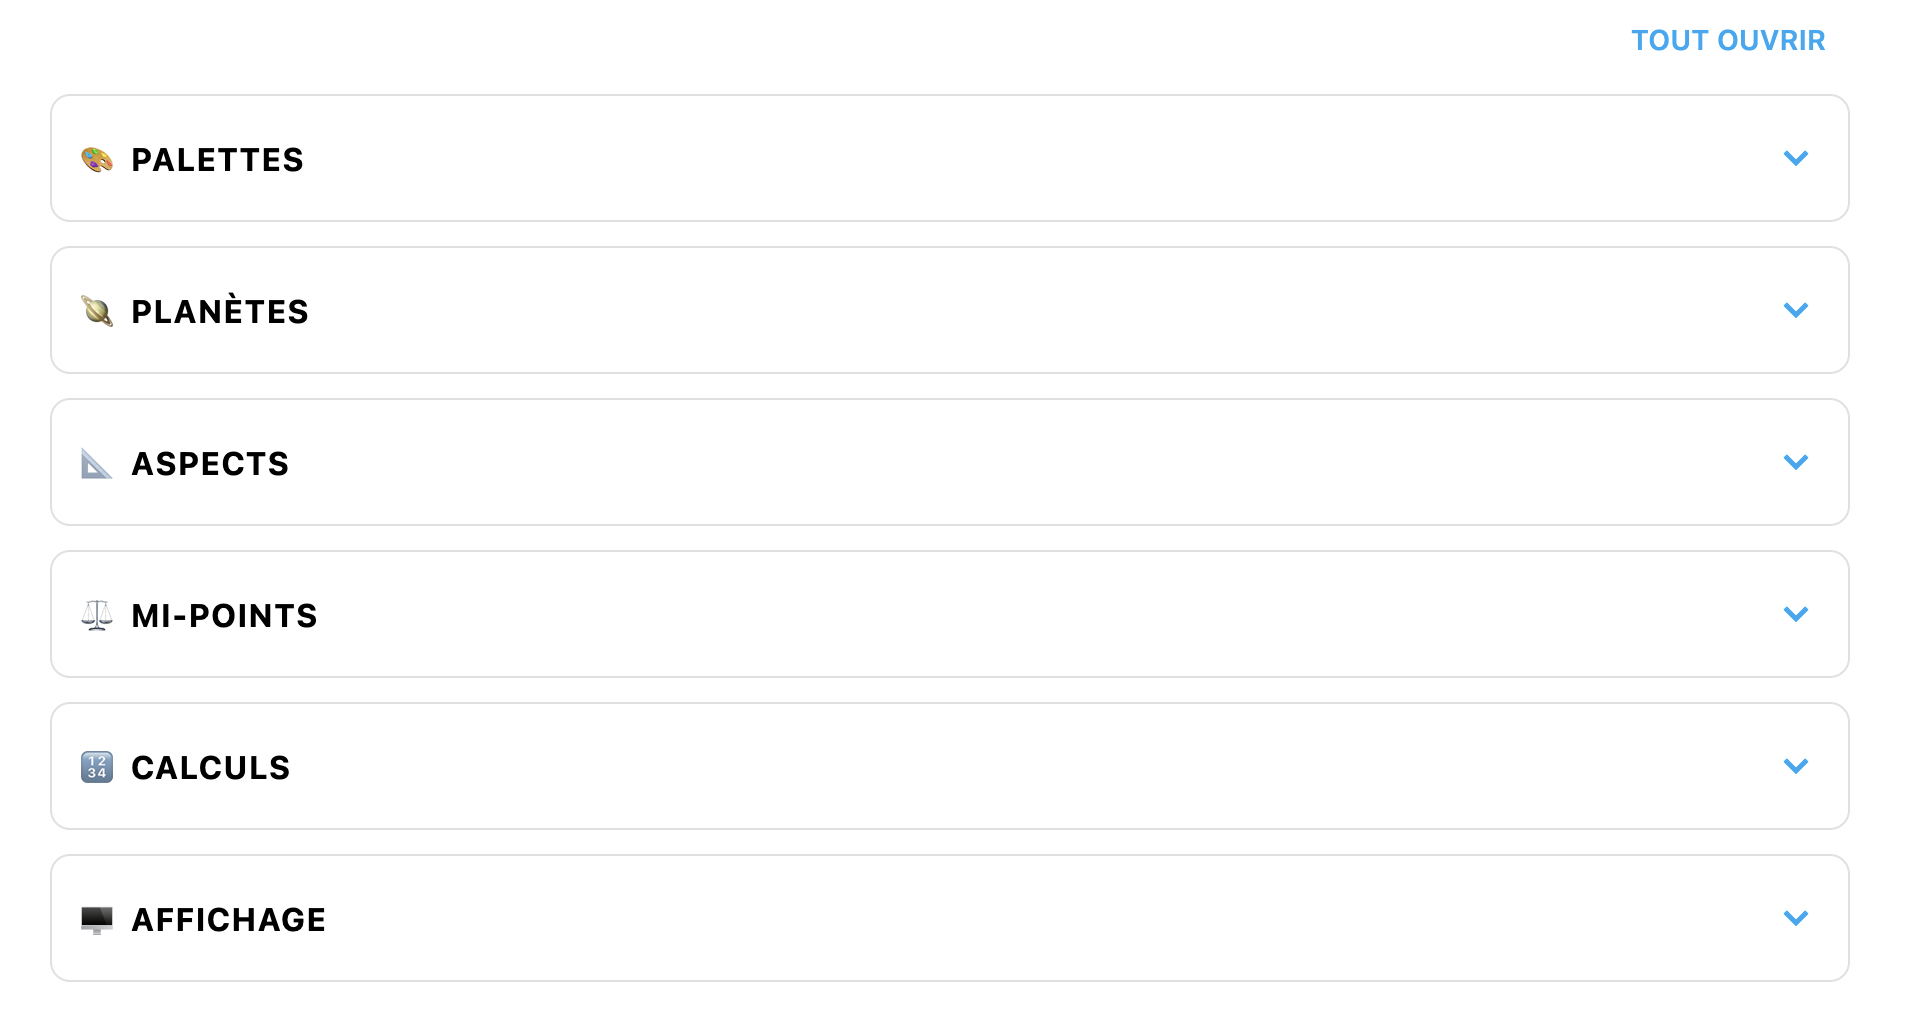
+ Let’s talk for a moment about the settings panel. It is now built “accordion-style”. So you can open and close sections to browse the settings more easily:
And precisely, a few small changes were made in the 🖥️ DISPLAY section.
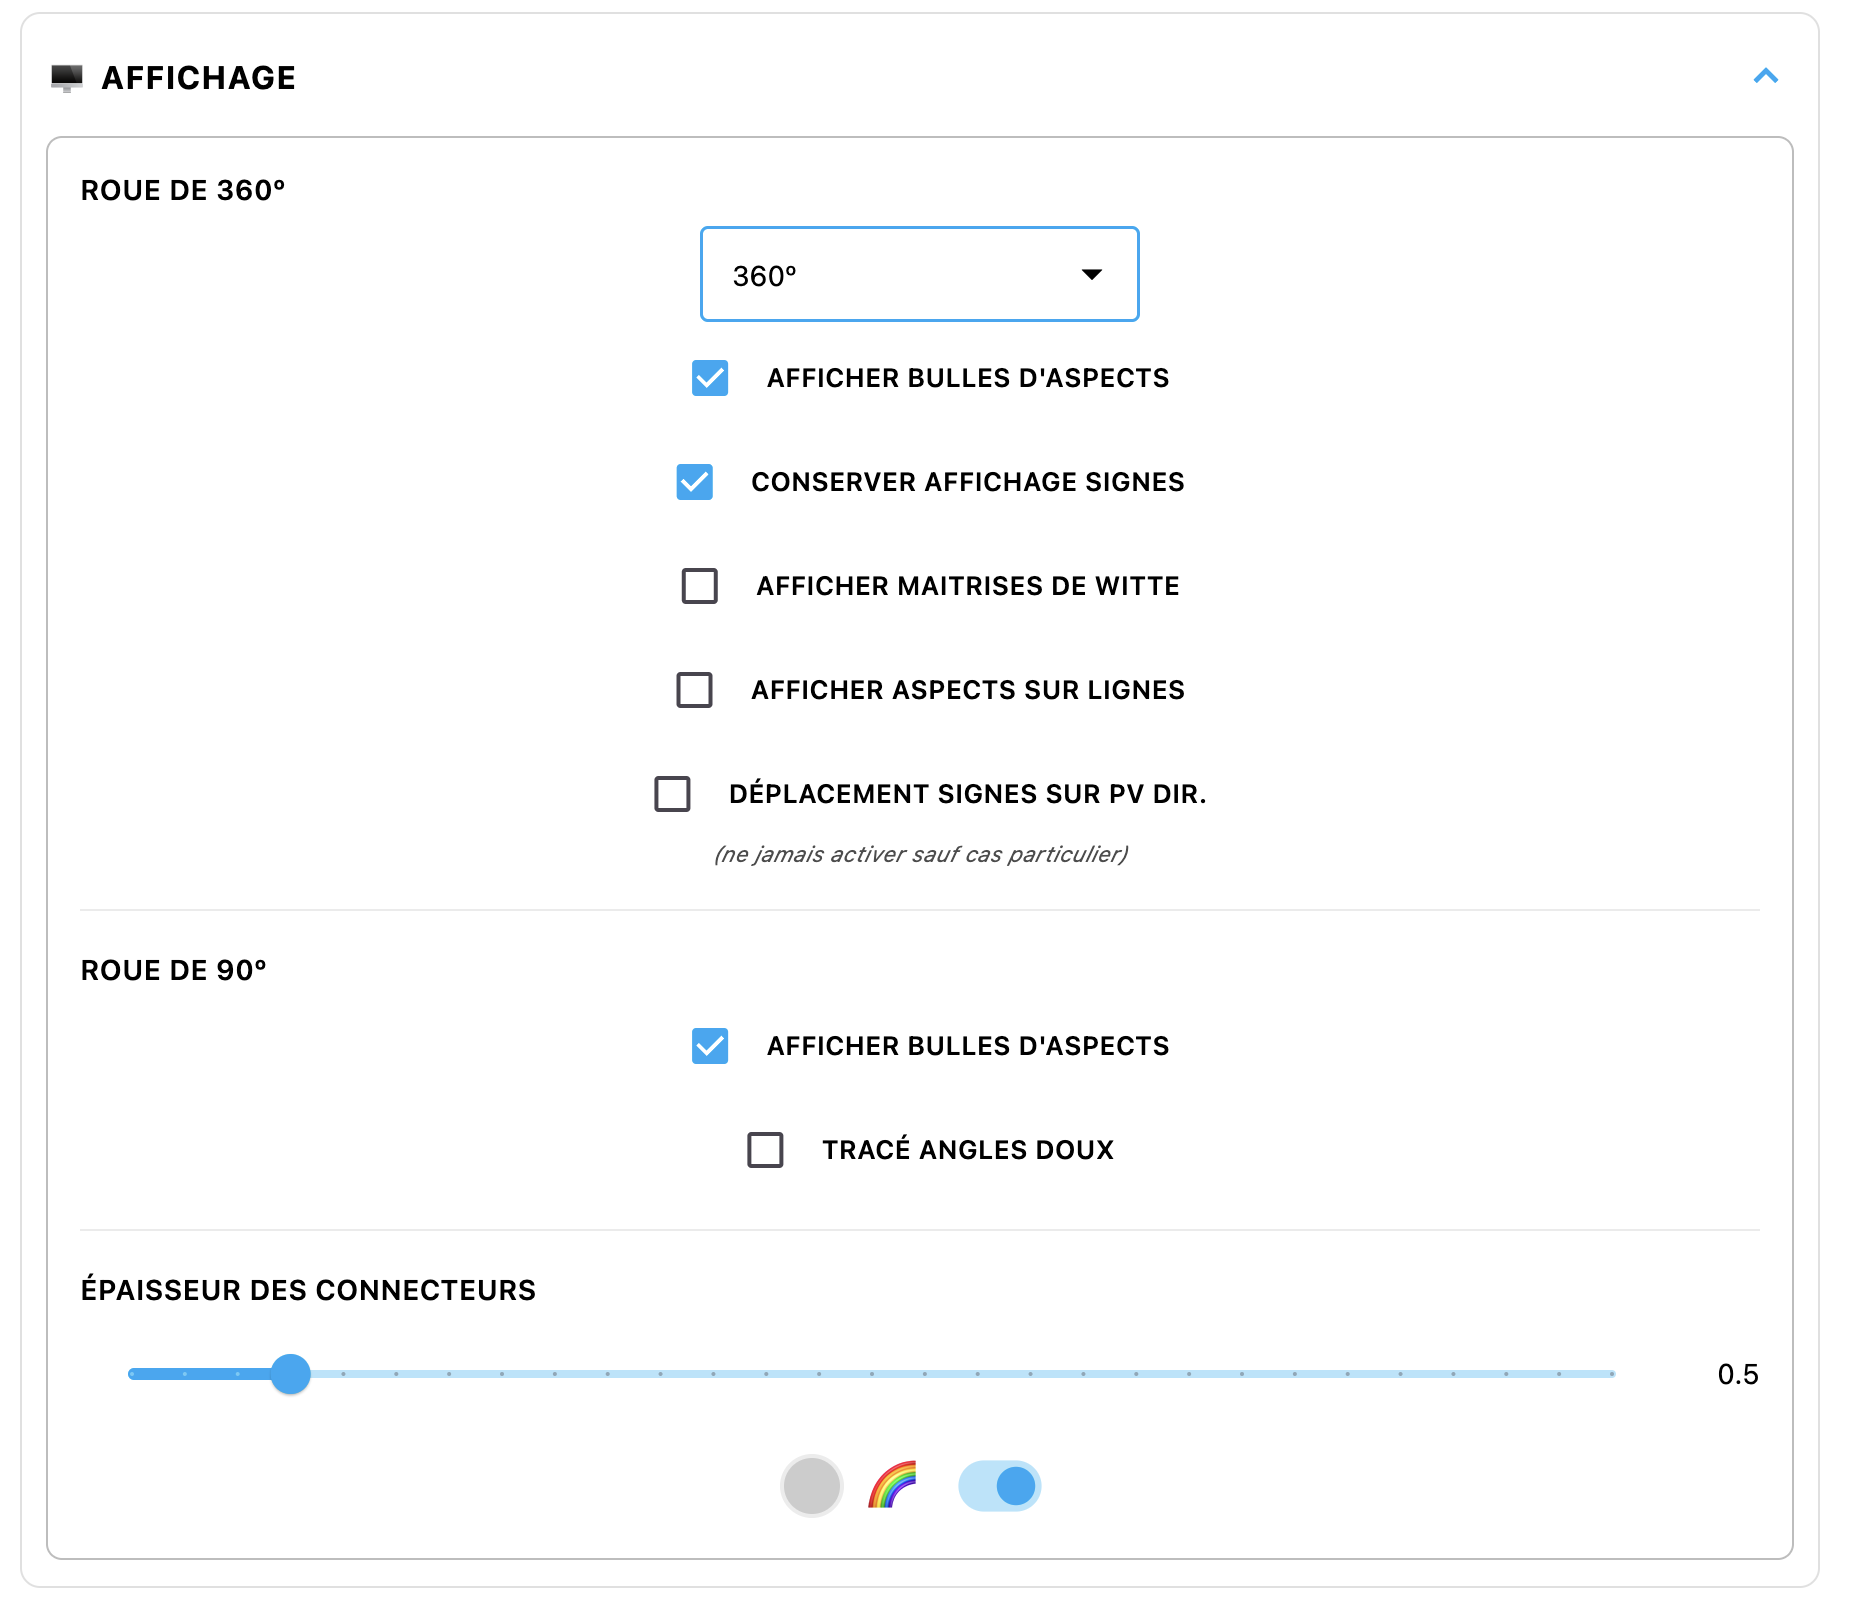
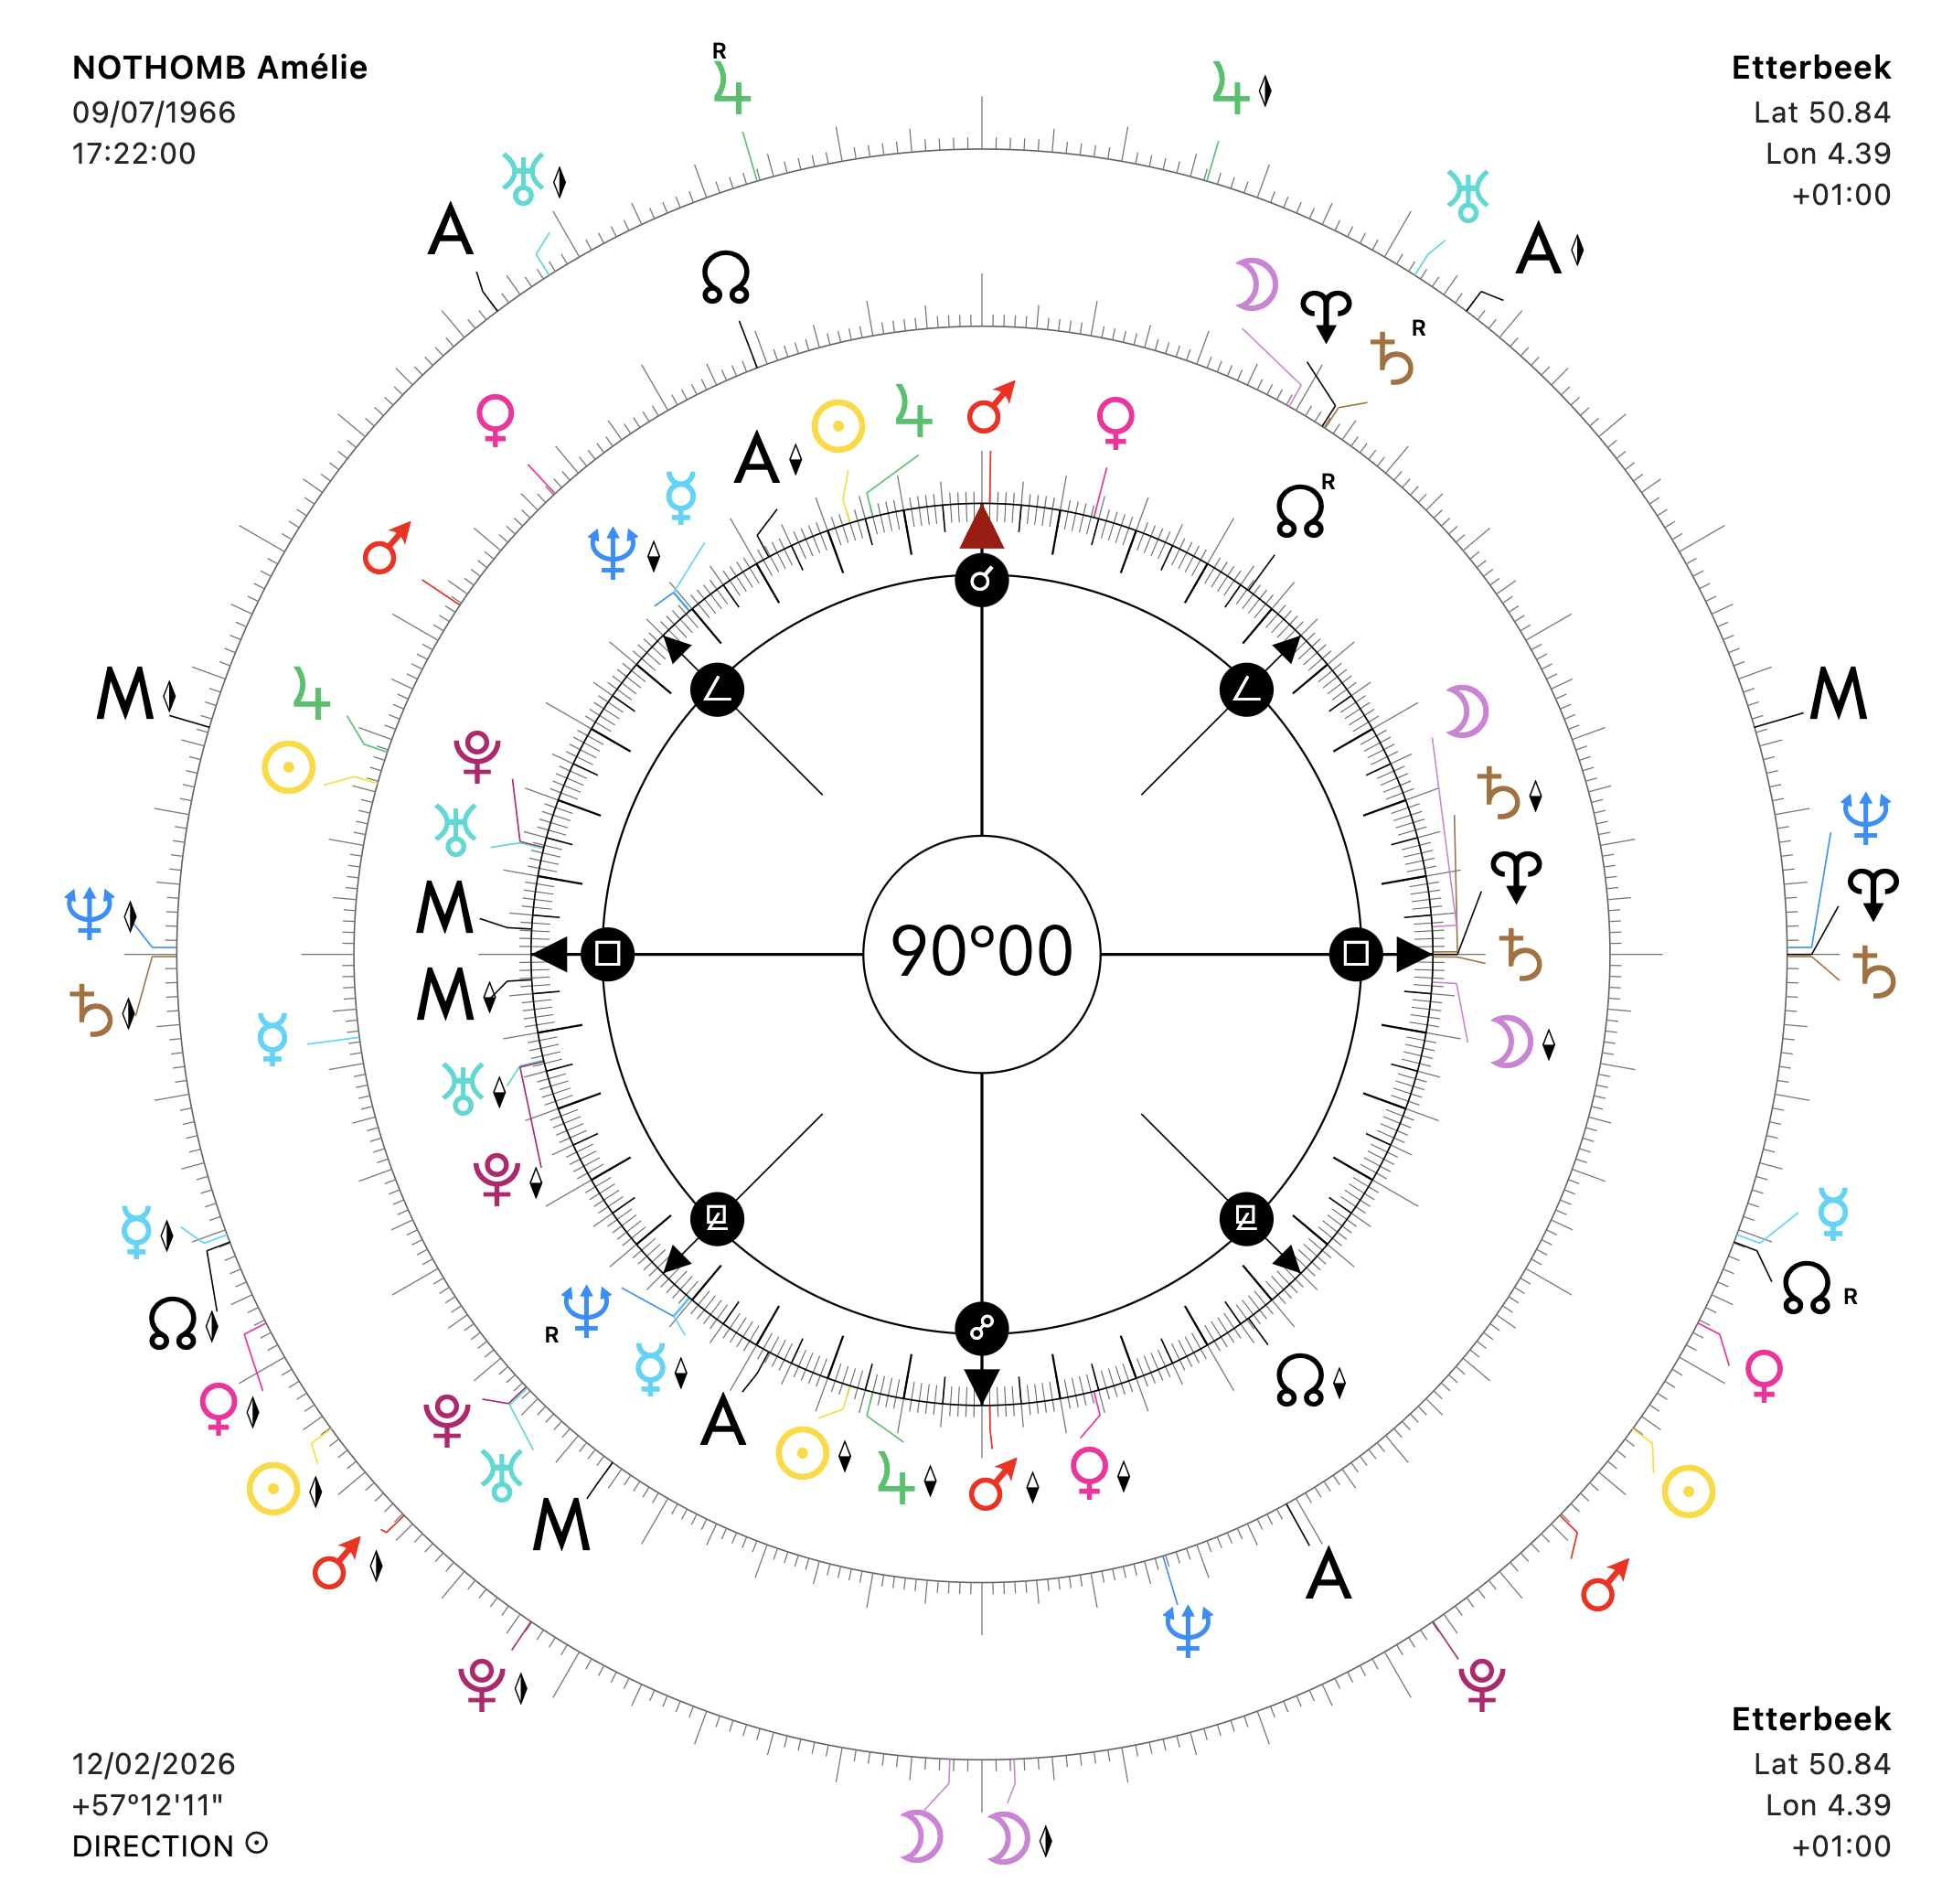
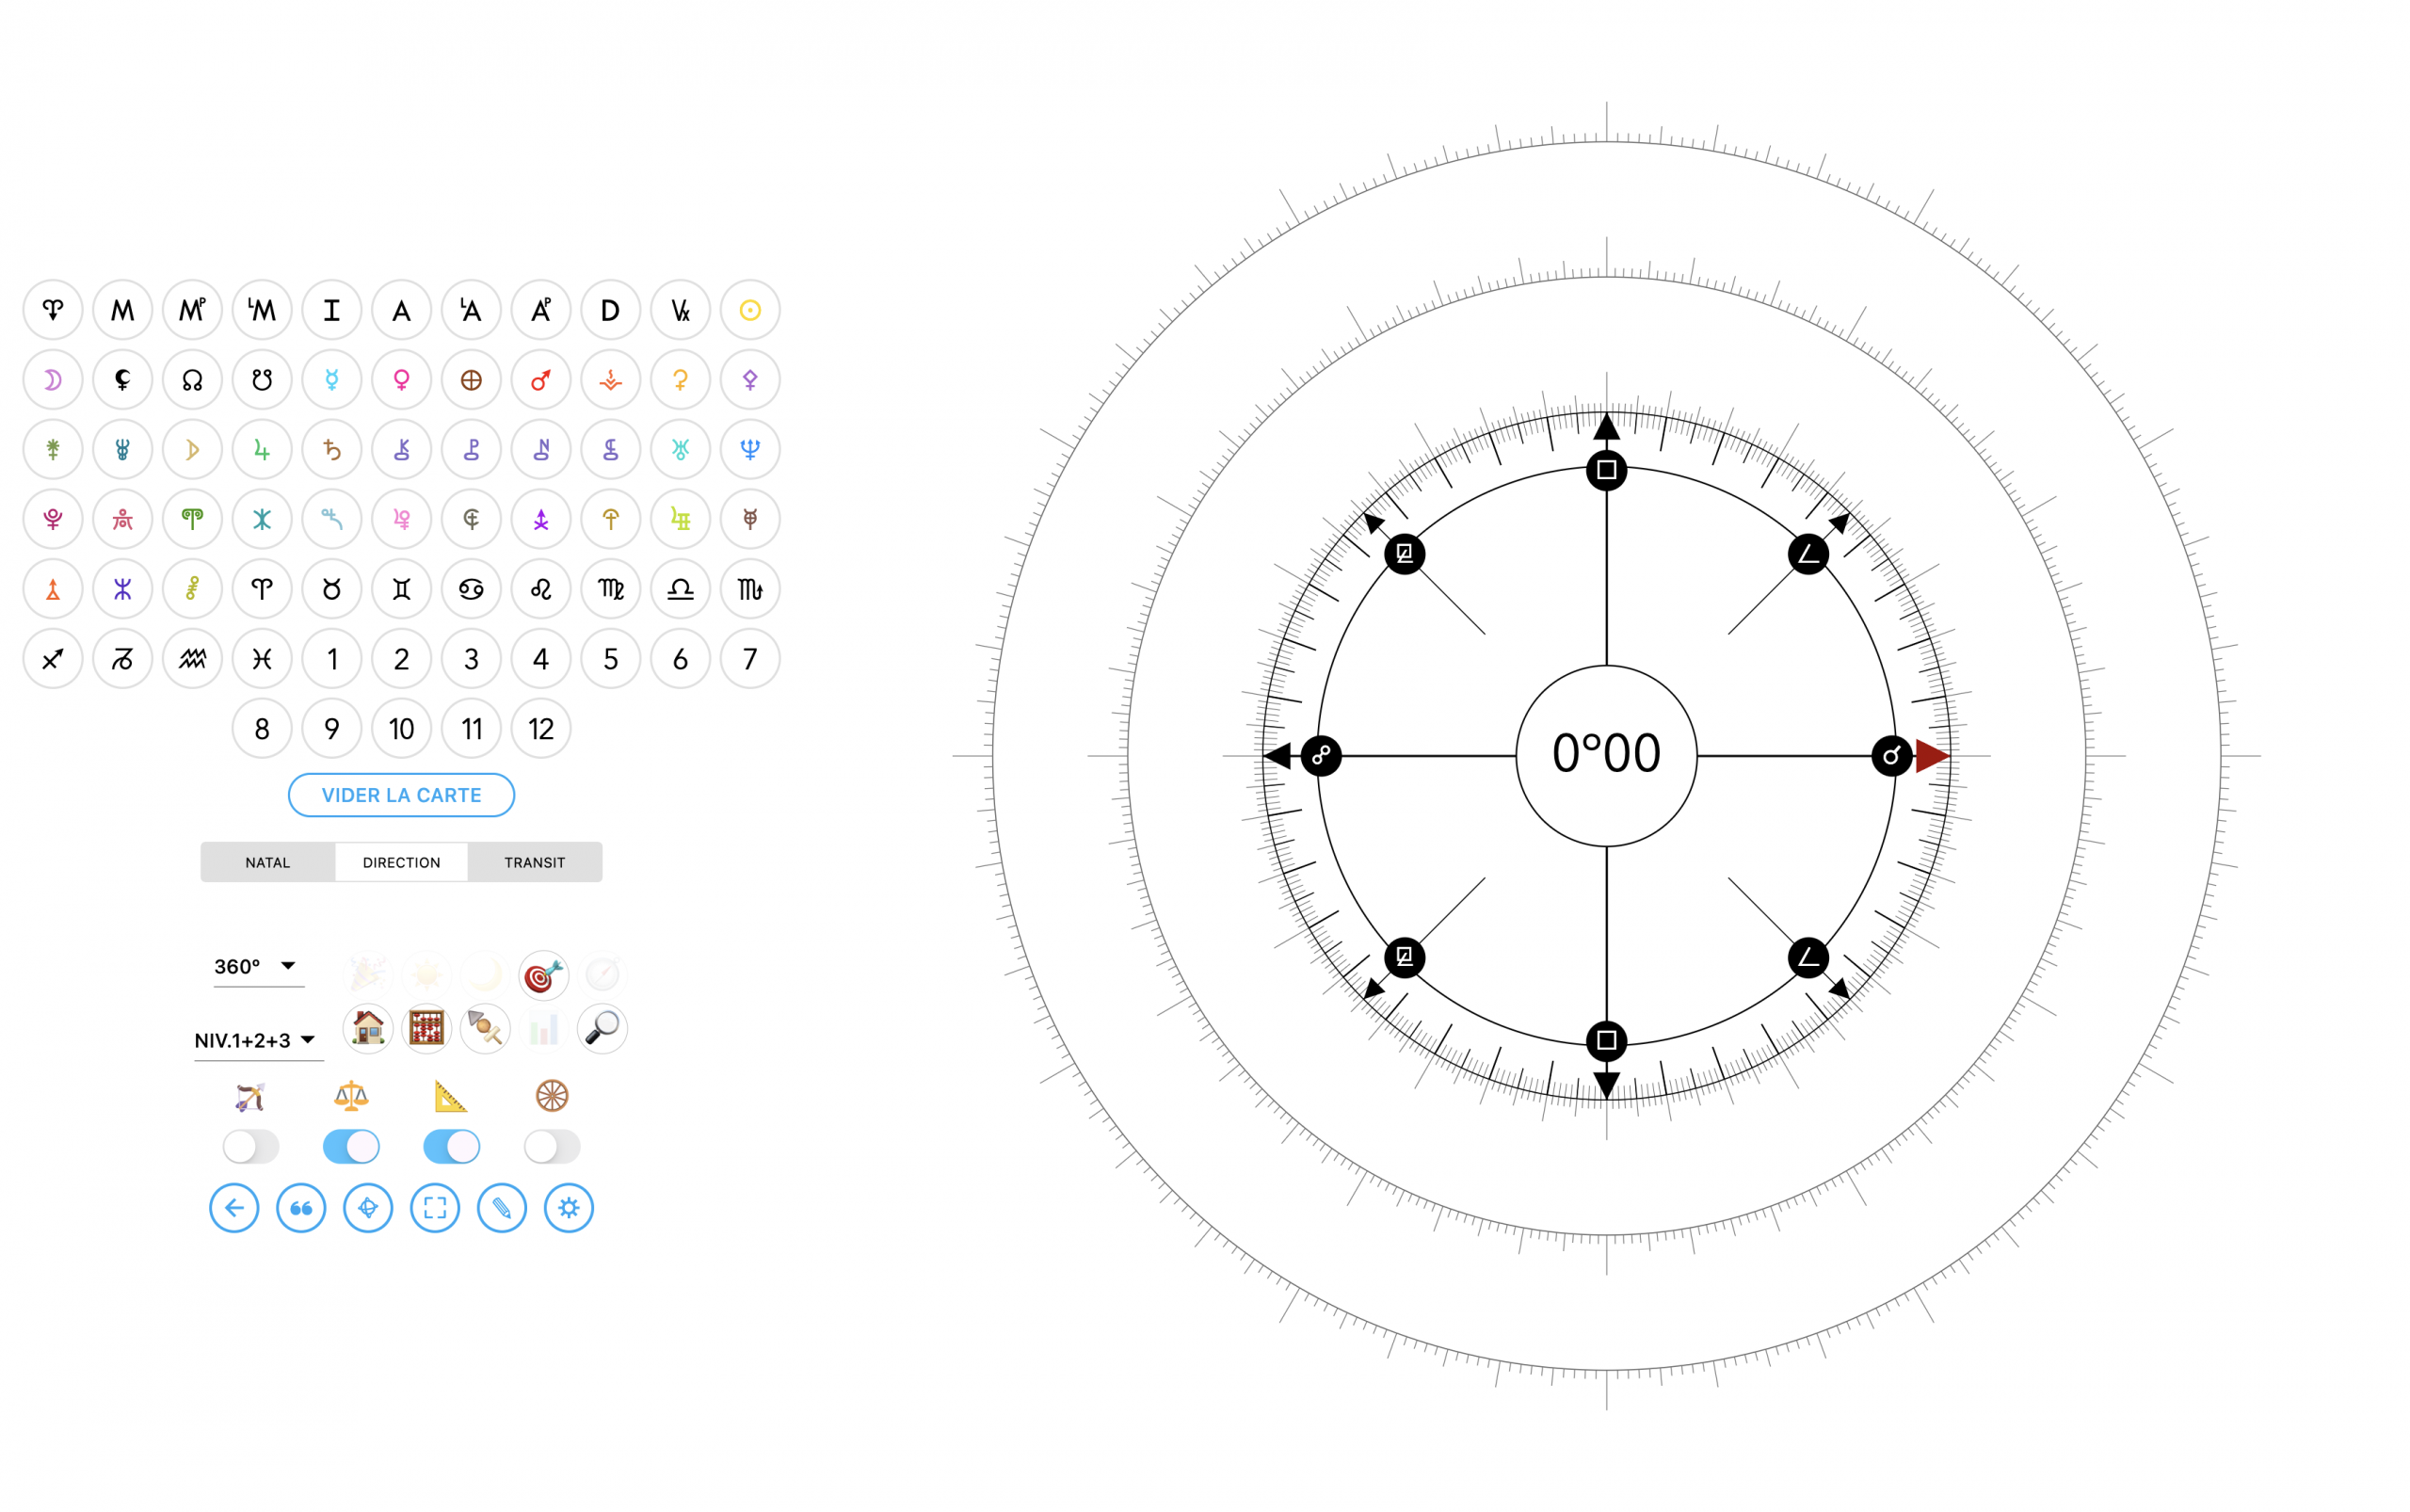
Because it is now possible to display or not the plus aspects, as well as the drawing of soft angles on the 90º wheel, and for the 360º wheel, only the bubbles+symbols of the angles you activated will appear:
I specify that on the 90º wheel, even if it is possible to show the two additional lines to detect soft angles (t s x w), this is only for “visual” detection. Uranian harmonic wheels are not made to detect soft angles, but only hard angles. For soft angles, you would need to create a 120º wheel, or a 60º wheel, for example.
+ Still from the settings panel, you now have the option to enable an option that displays the aspect symbol in the middle of the angle/midpoint line. Always nice…
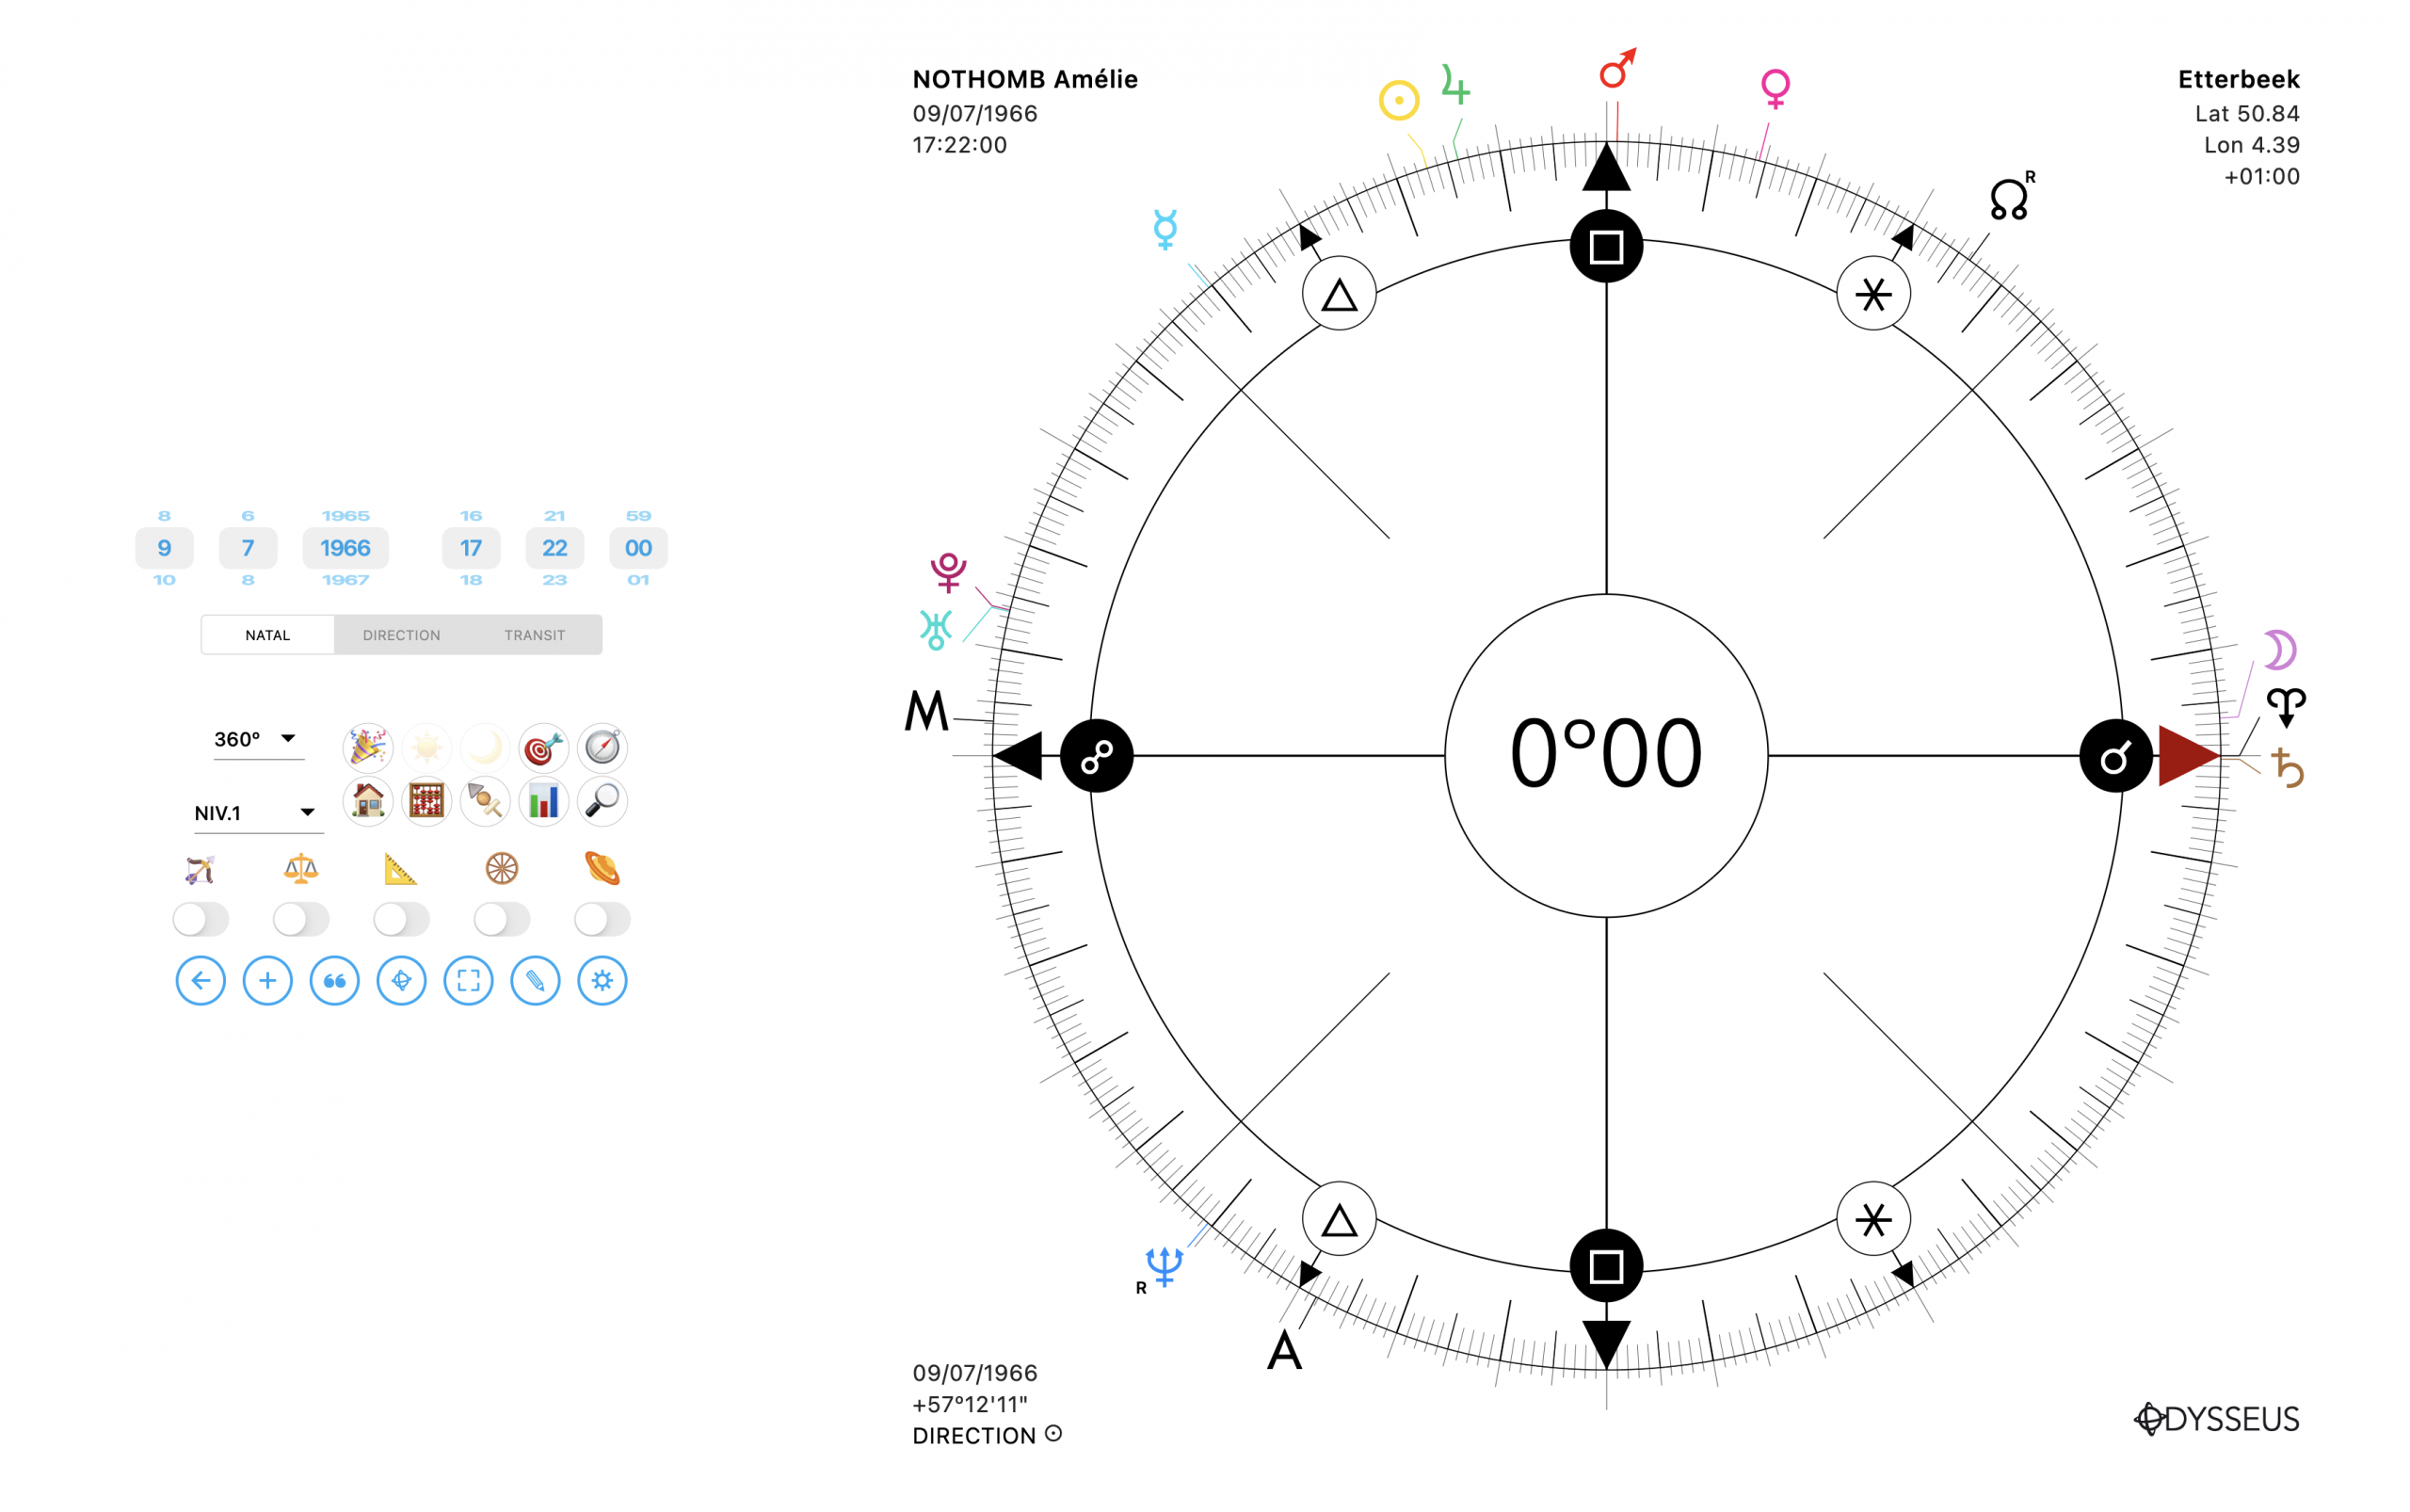
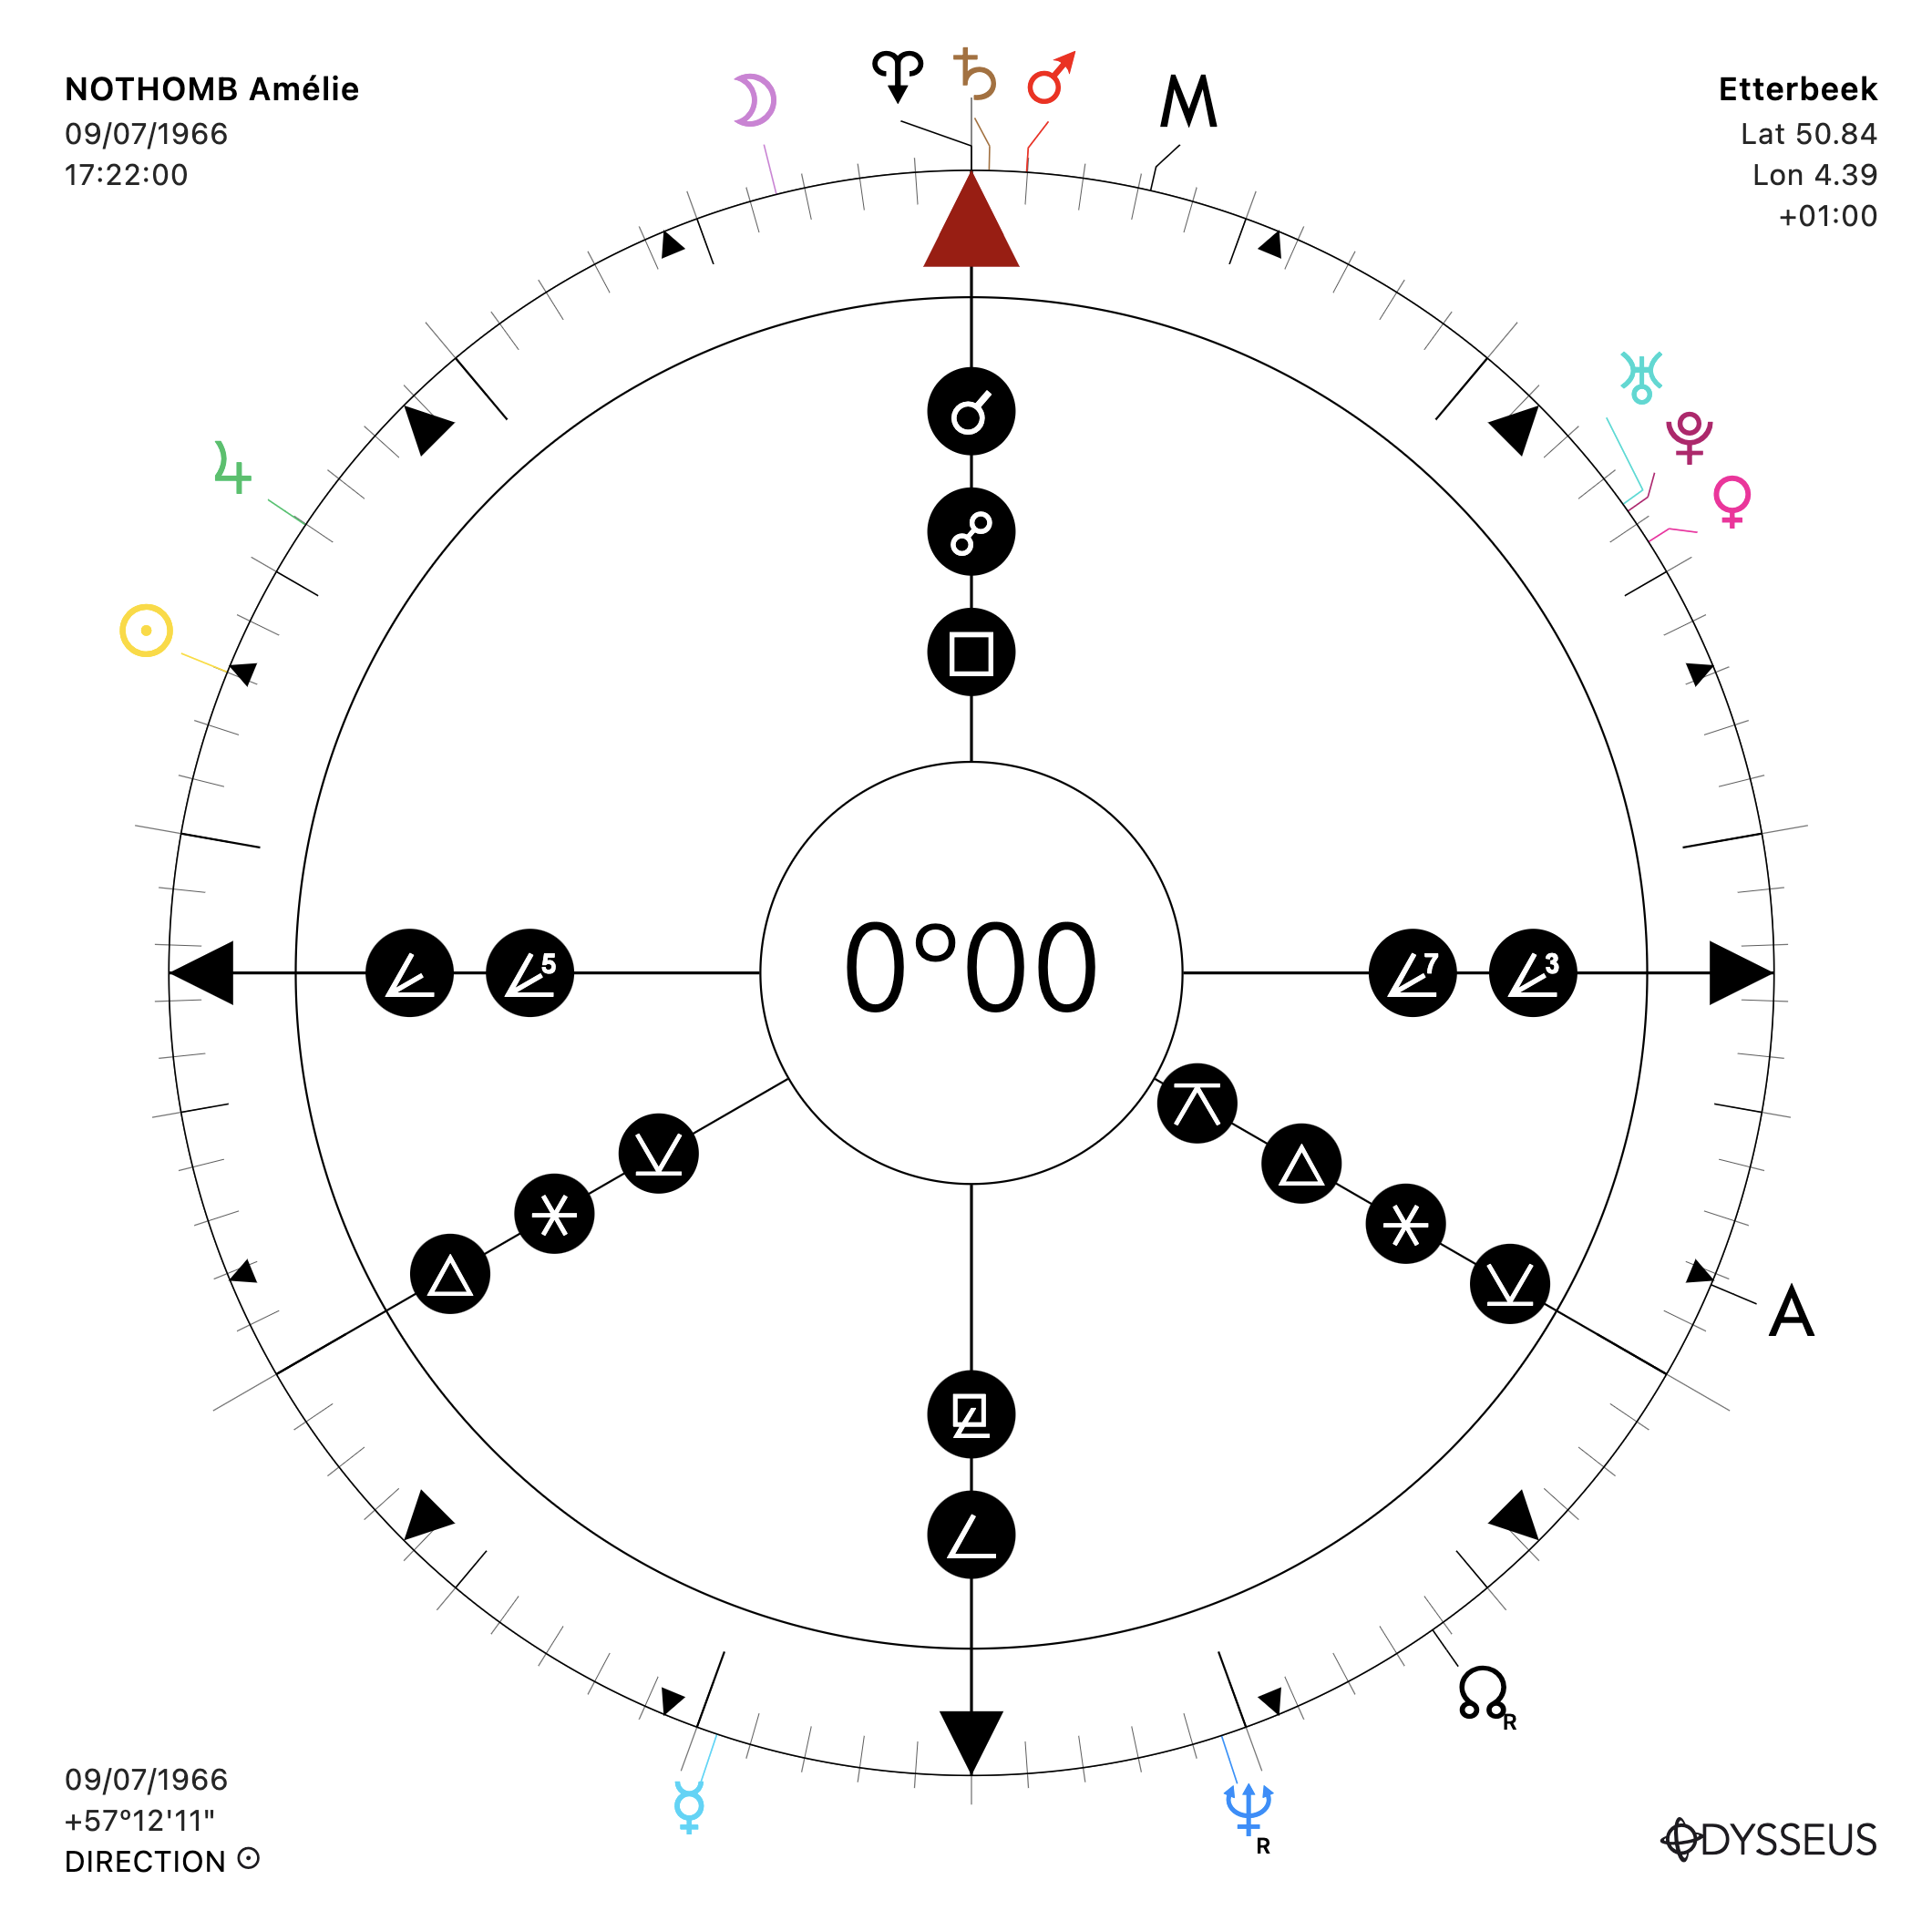
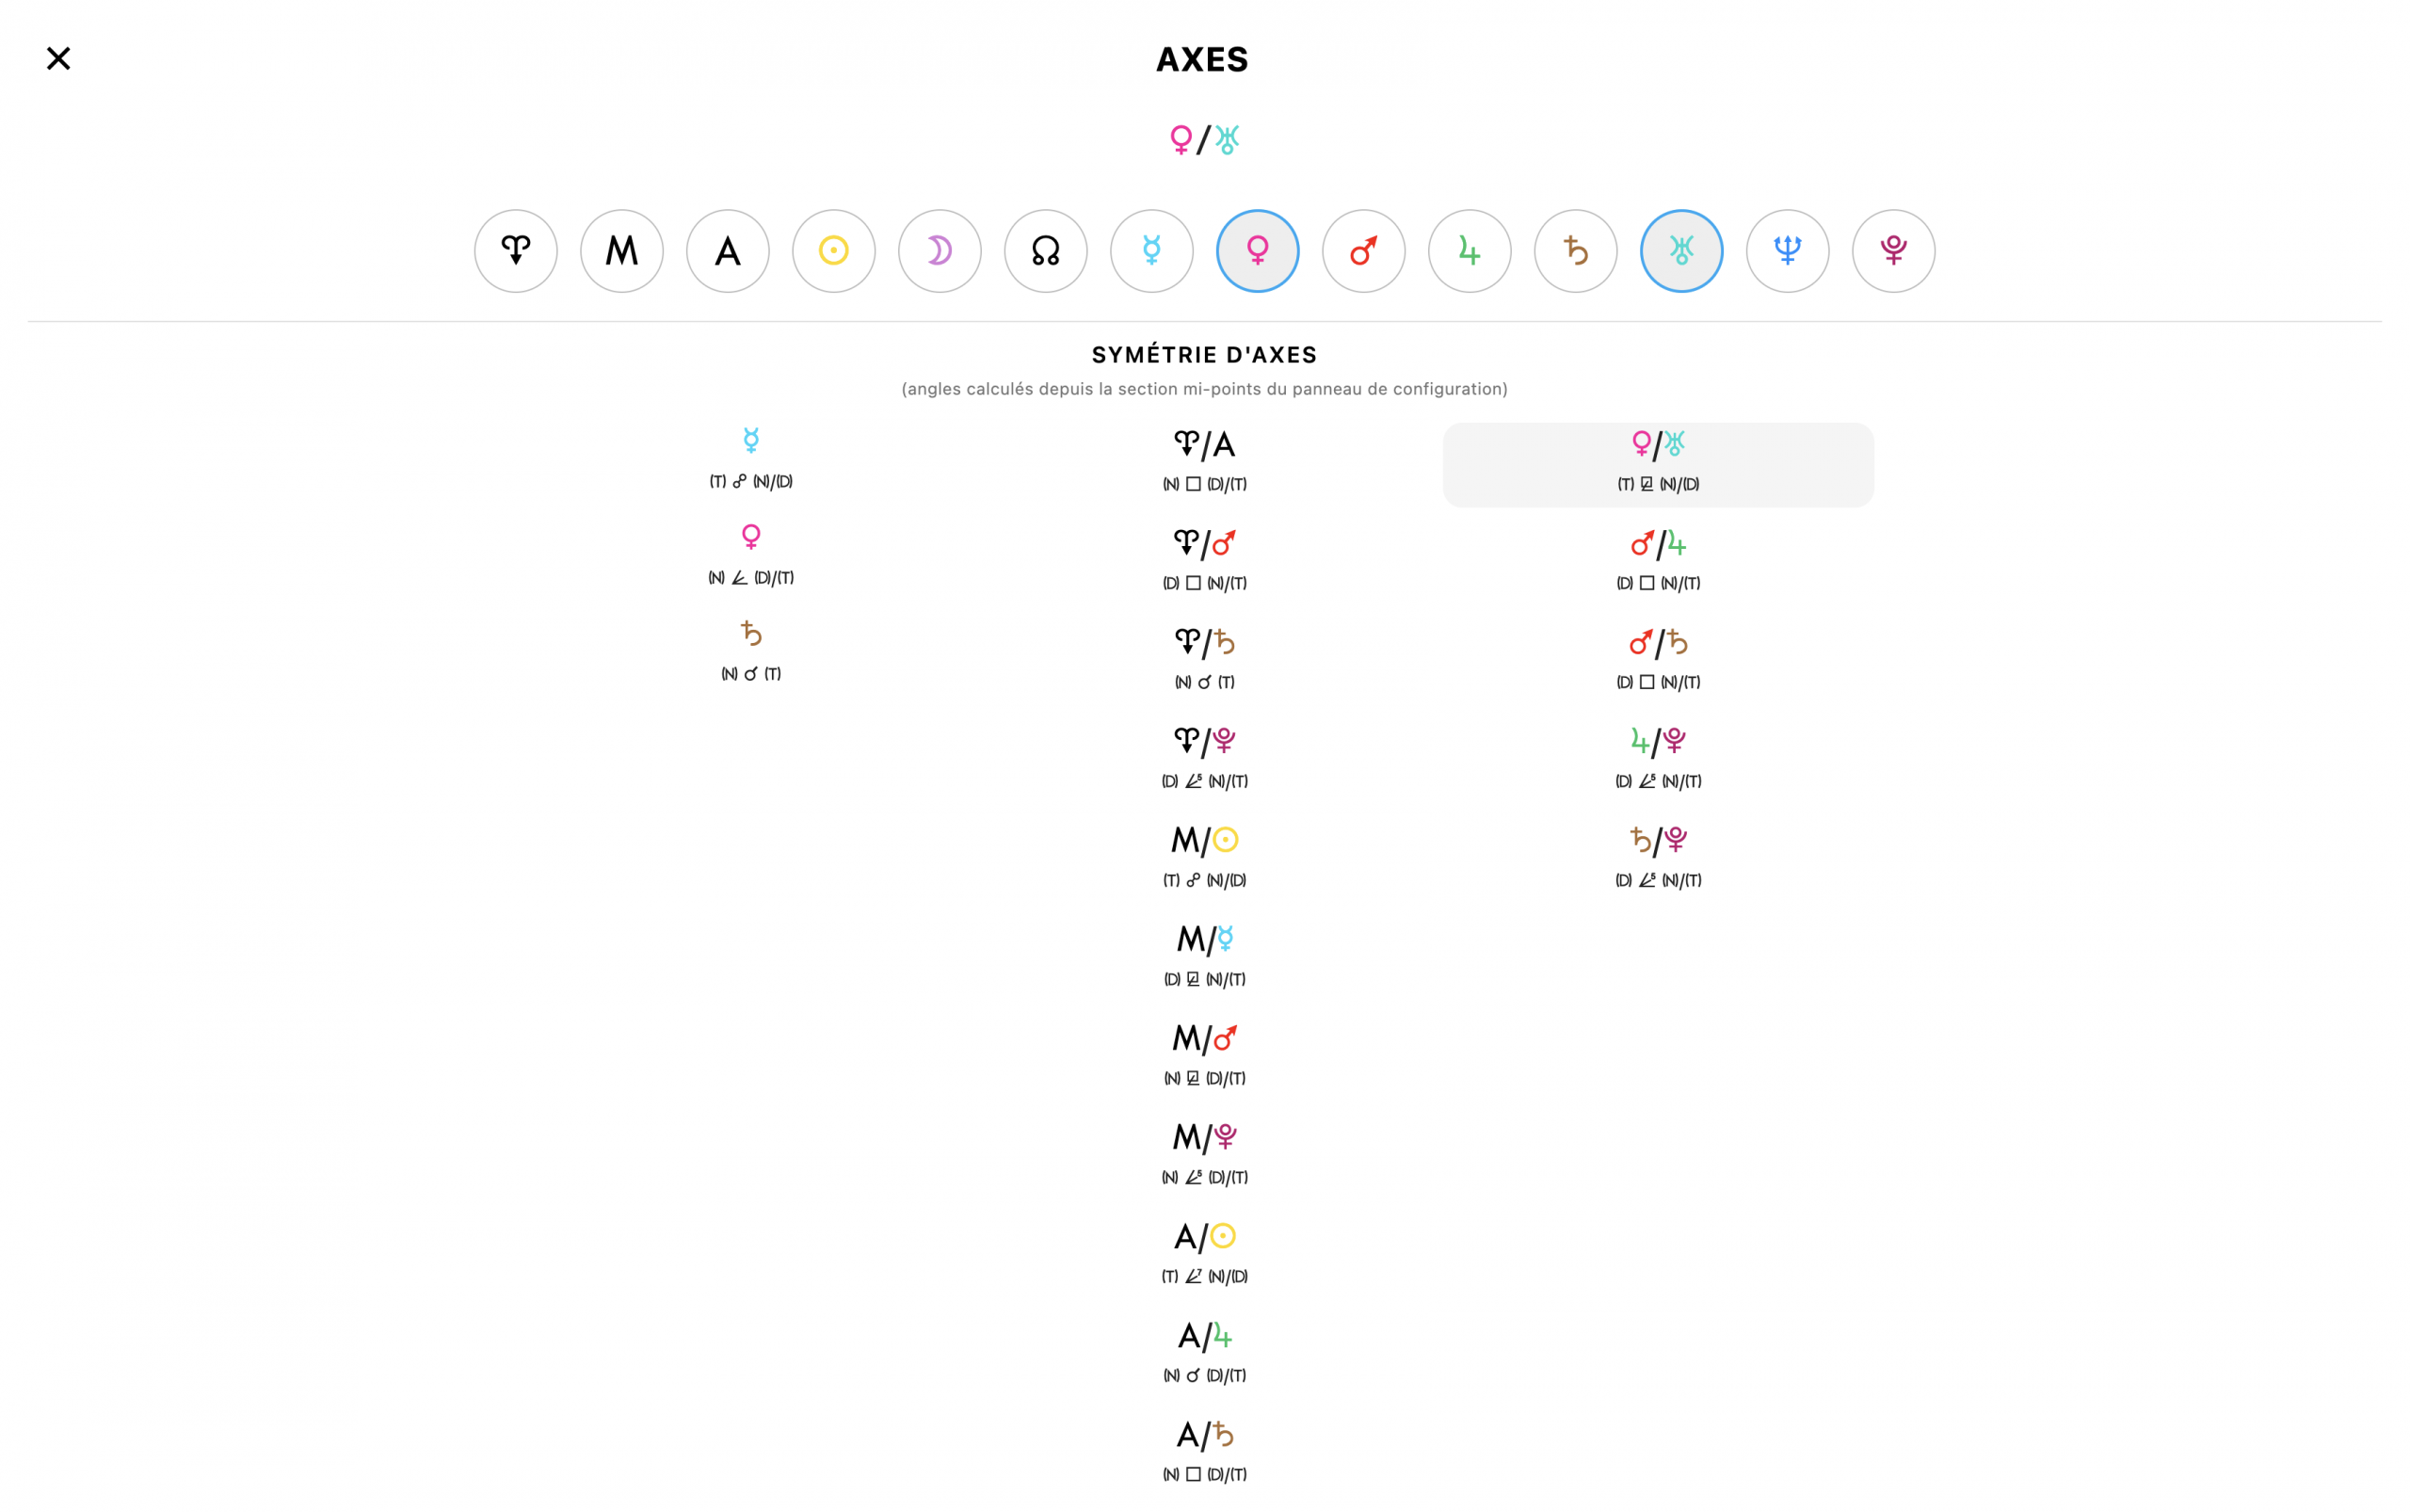
+ Another thing. You know the “Axes” tool (single click on 🎯) that displays lines pointing toward a planet, a midpoint, or a sensitive point. The line colors were sometimes strange, the gradients not rendering correctly. That’s fixed…
+ …but above all, the page now directly shows a list of axis symmetries, a practice that will only interest a few rare practitioners, but which has the merit of being the first in the world! No software until now provided axis symmetry detection. Very happy, therefore, to offer this tool which, personally, I love using in solar revolution analysis.
+ Two other new features: first, the Horoscopes list has been expanded in order to match the articles written by Witte and thus align with his methodology.
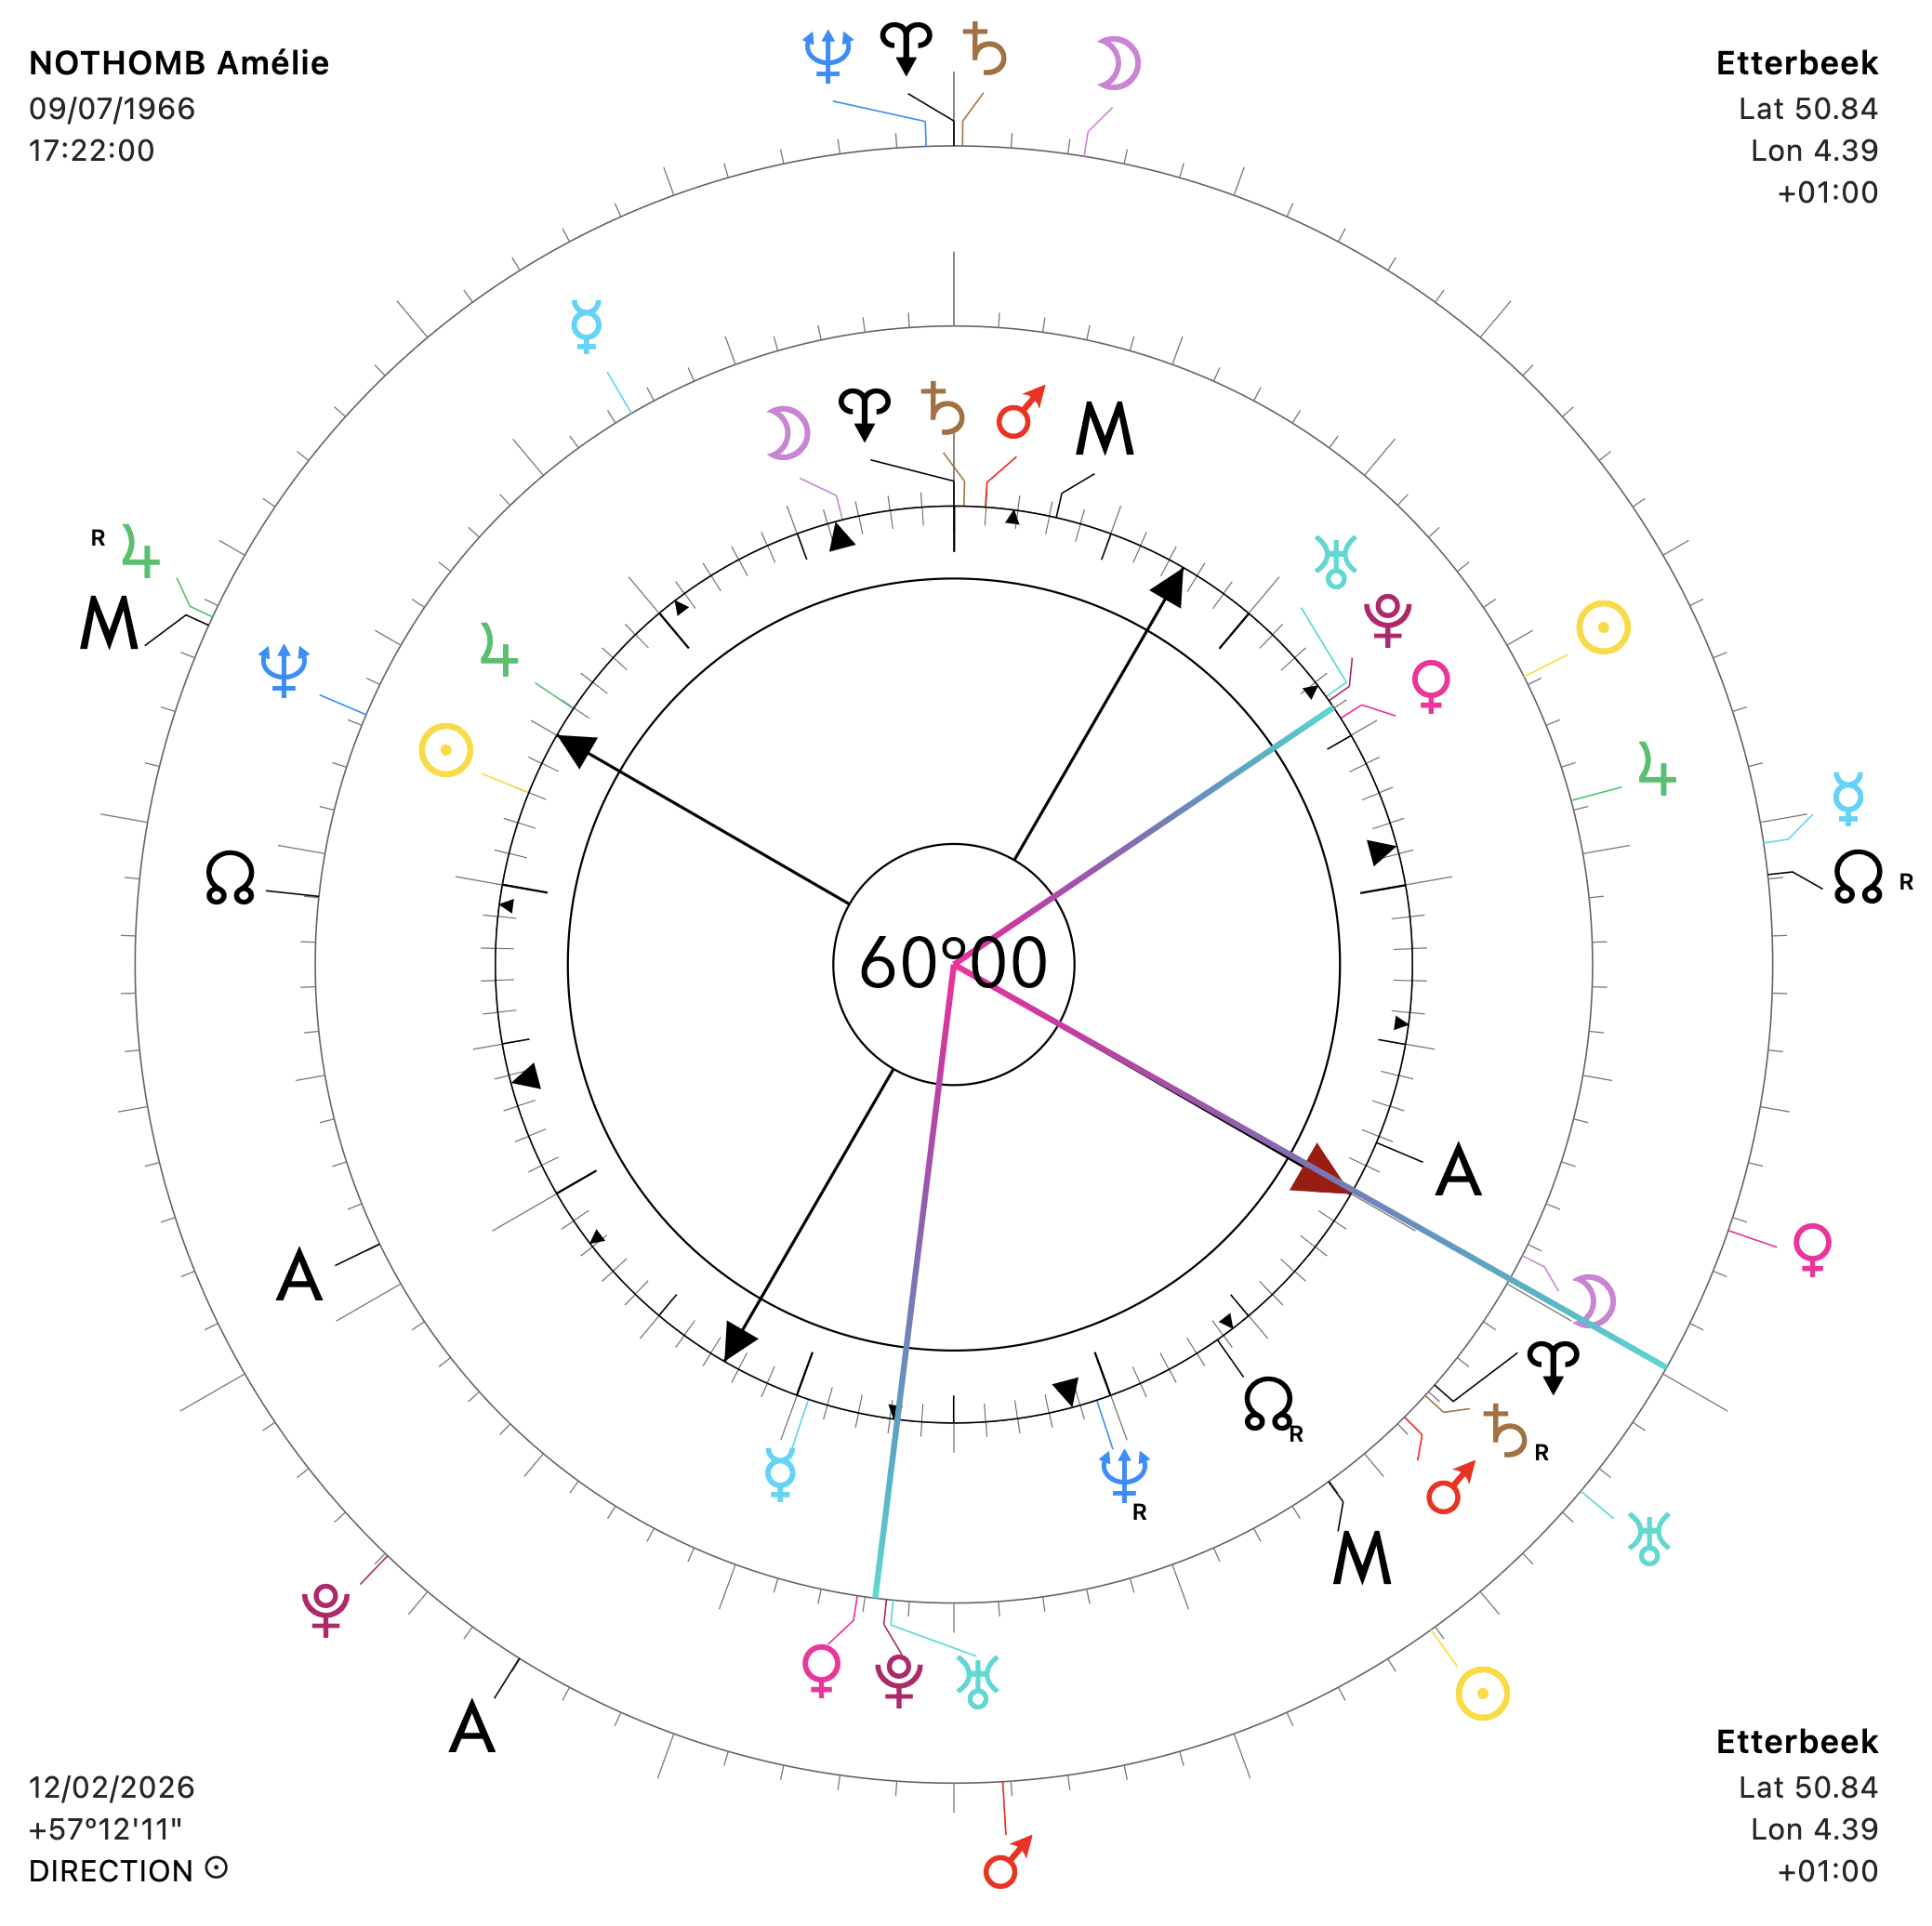
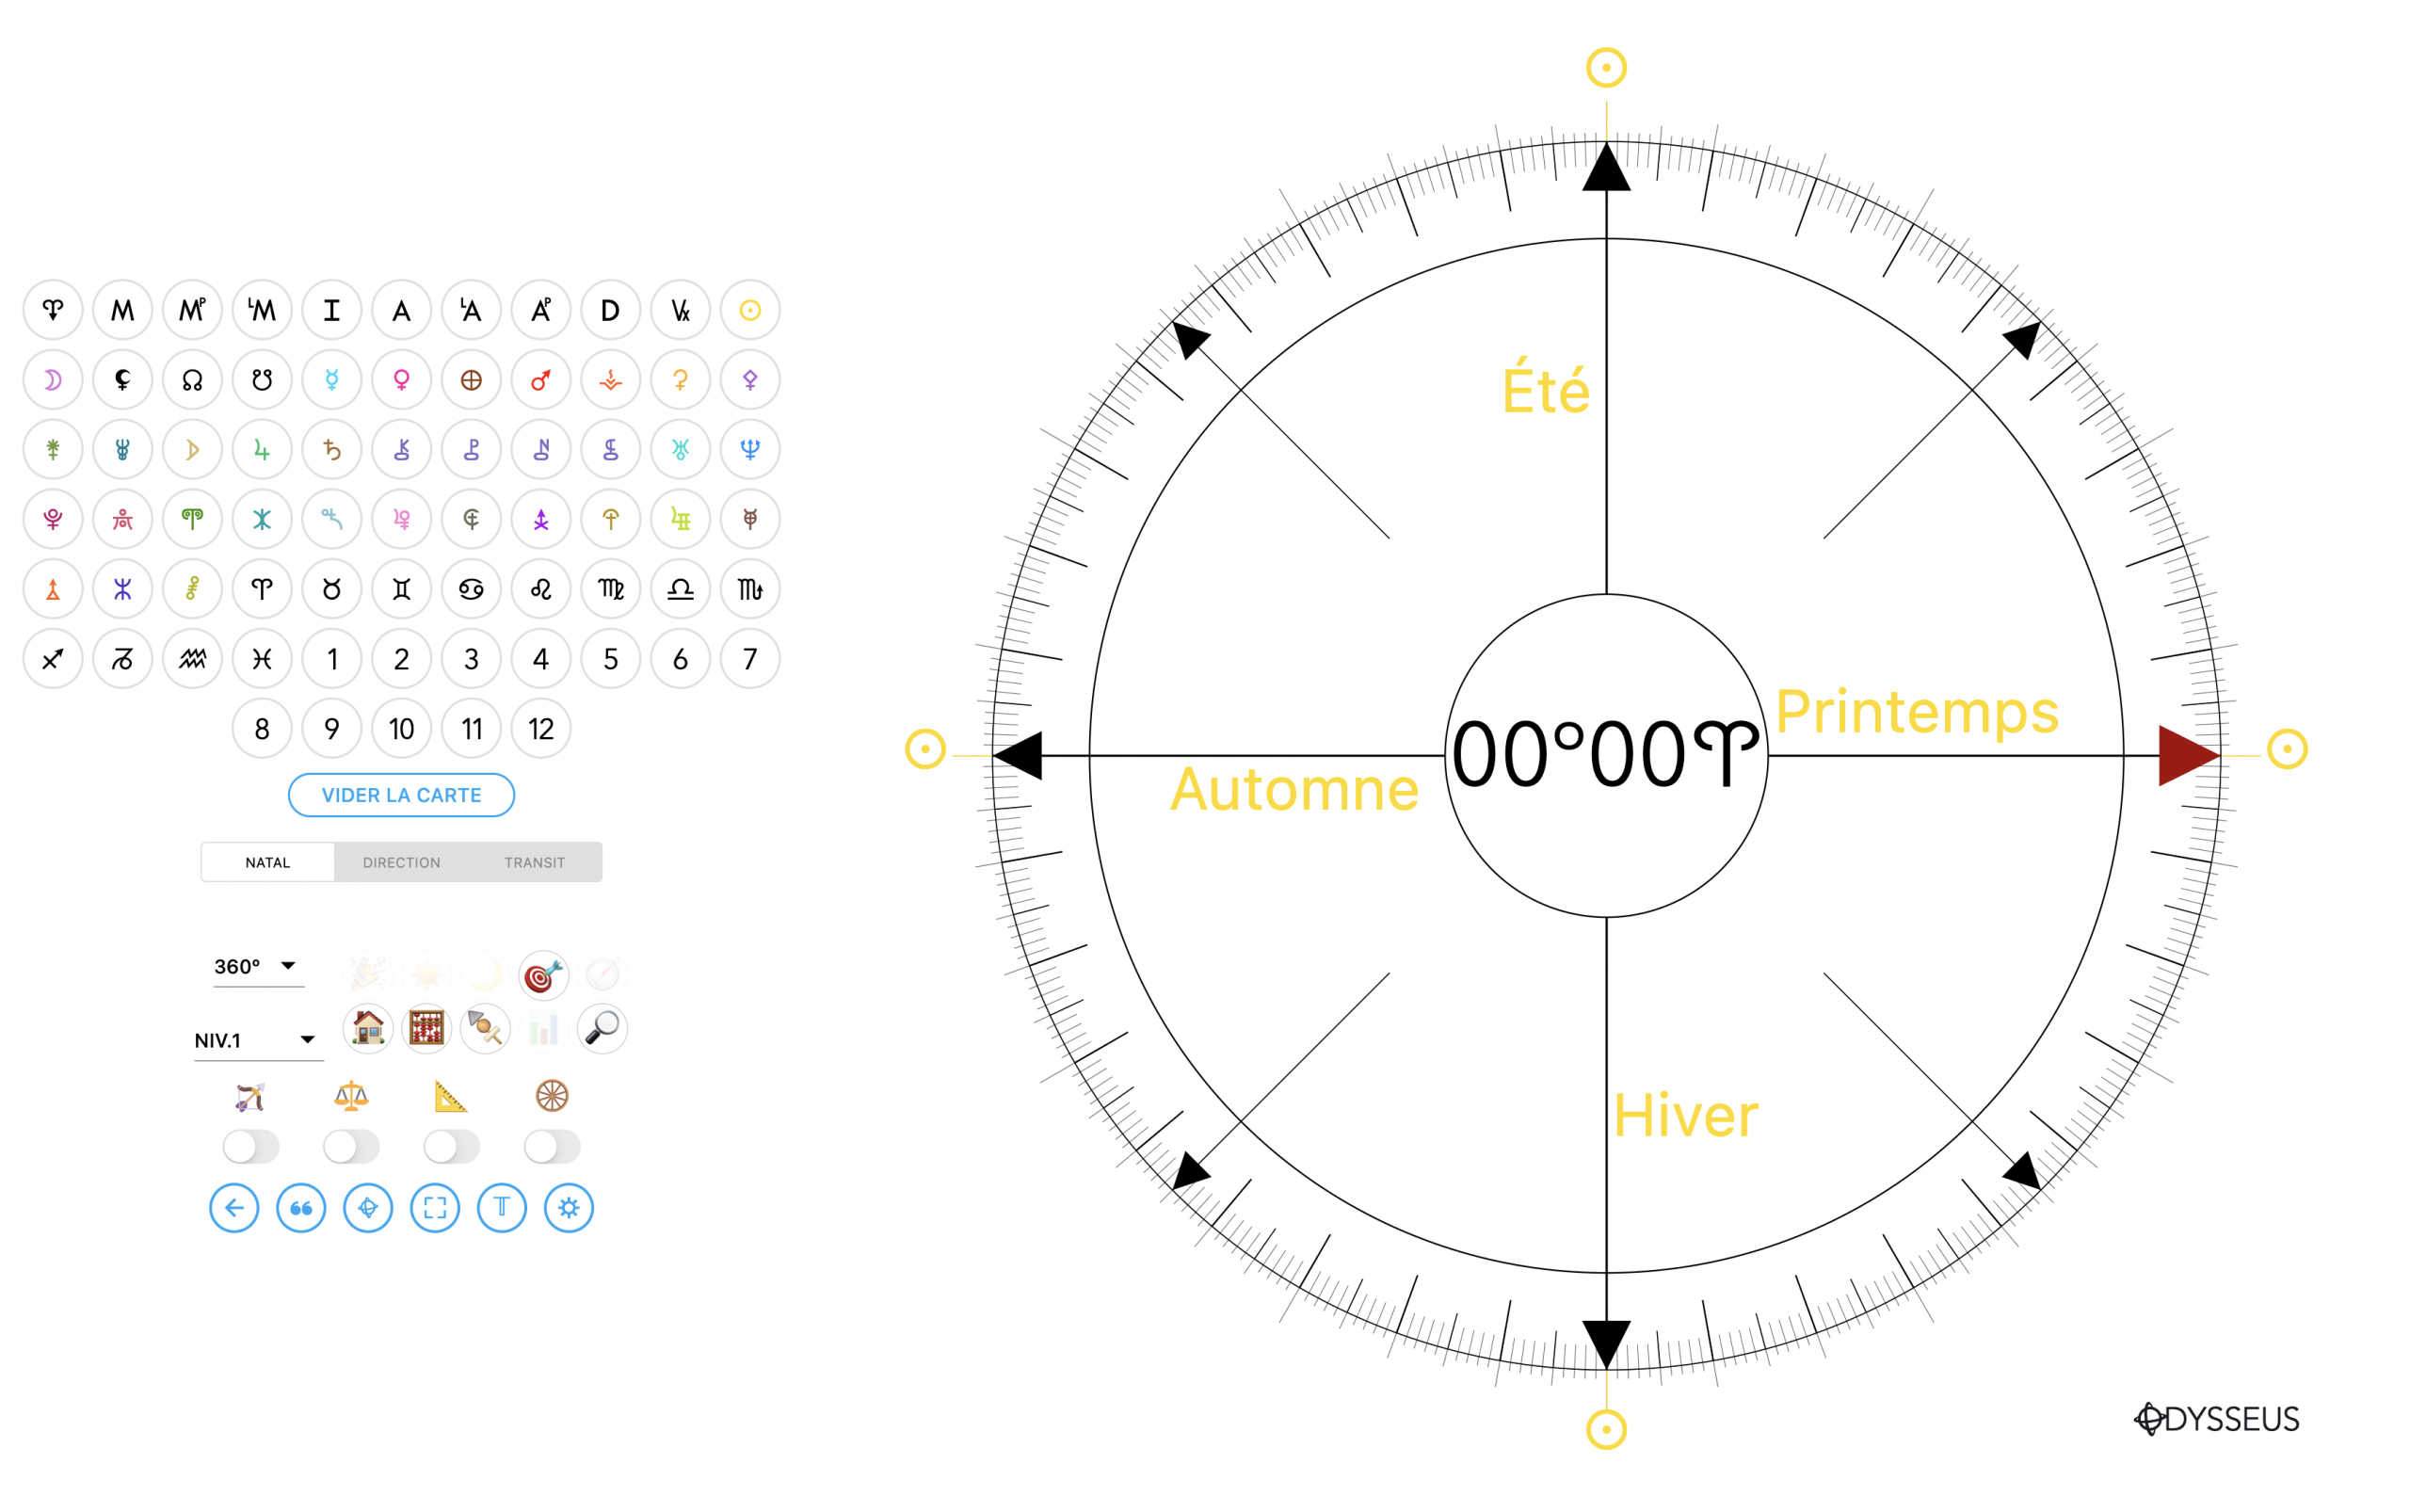
+ And second, the possibility to display Antiscia and Contra-antiscia directly on the wheel, in accordance with the axis chosen in the horoscope (so not necessarily the solstitial or equinoctial axis):
+ Another new feature: now, when you do a relocation, if you click on “📍 Set as default city”, this city will be remembered for that specific chart and, the next time you open it, it will already be loaded for transits and relocated points.
![]()
+ Another new feature I’m thrilled to have implemented because it really improves life, but first, let’s start from the basic problem. You positioned the slider on TRANSIT because you want to change its date, but you want to see the aspects formed by that level with the natal. So you’re forced to switch back to NATAL. But if you want to change the transit date again, you have to change the slider once more. Well, not anymore:

Indeed, the slider now offers two positions. The first, with a single click, lets you select the level whose date you want to change and whose aspects you want to see. BUT! If you long-press on another level, then the aspect reading will be done on that level, while the date will still be the one from the level you single-clicked. Long-press again on the blue-outlined level, and it cancels. Simple and devilishly effective!
+ This also made it possible to highlight another problem: the dates loaded from the notes panel ❝. If you were on the natal level, the date was loaded into natal, making a joyful mess. Now, if you are on the natal level and you load a date, a popup will ask you to confirm the level on which to load the event:
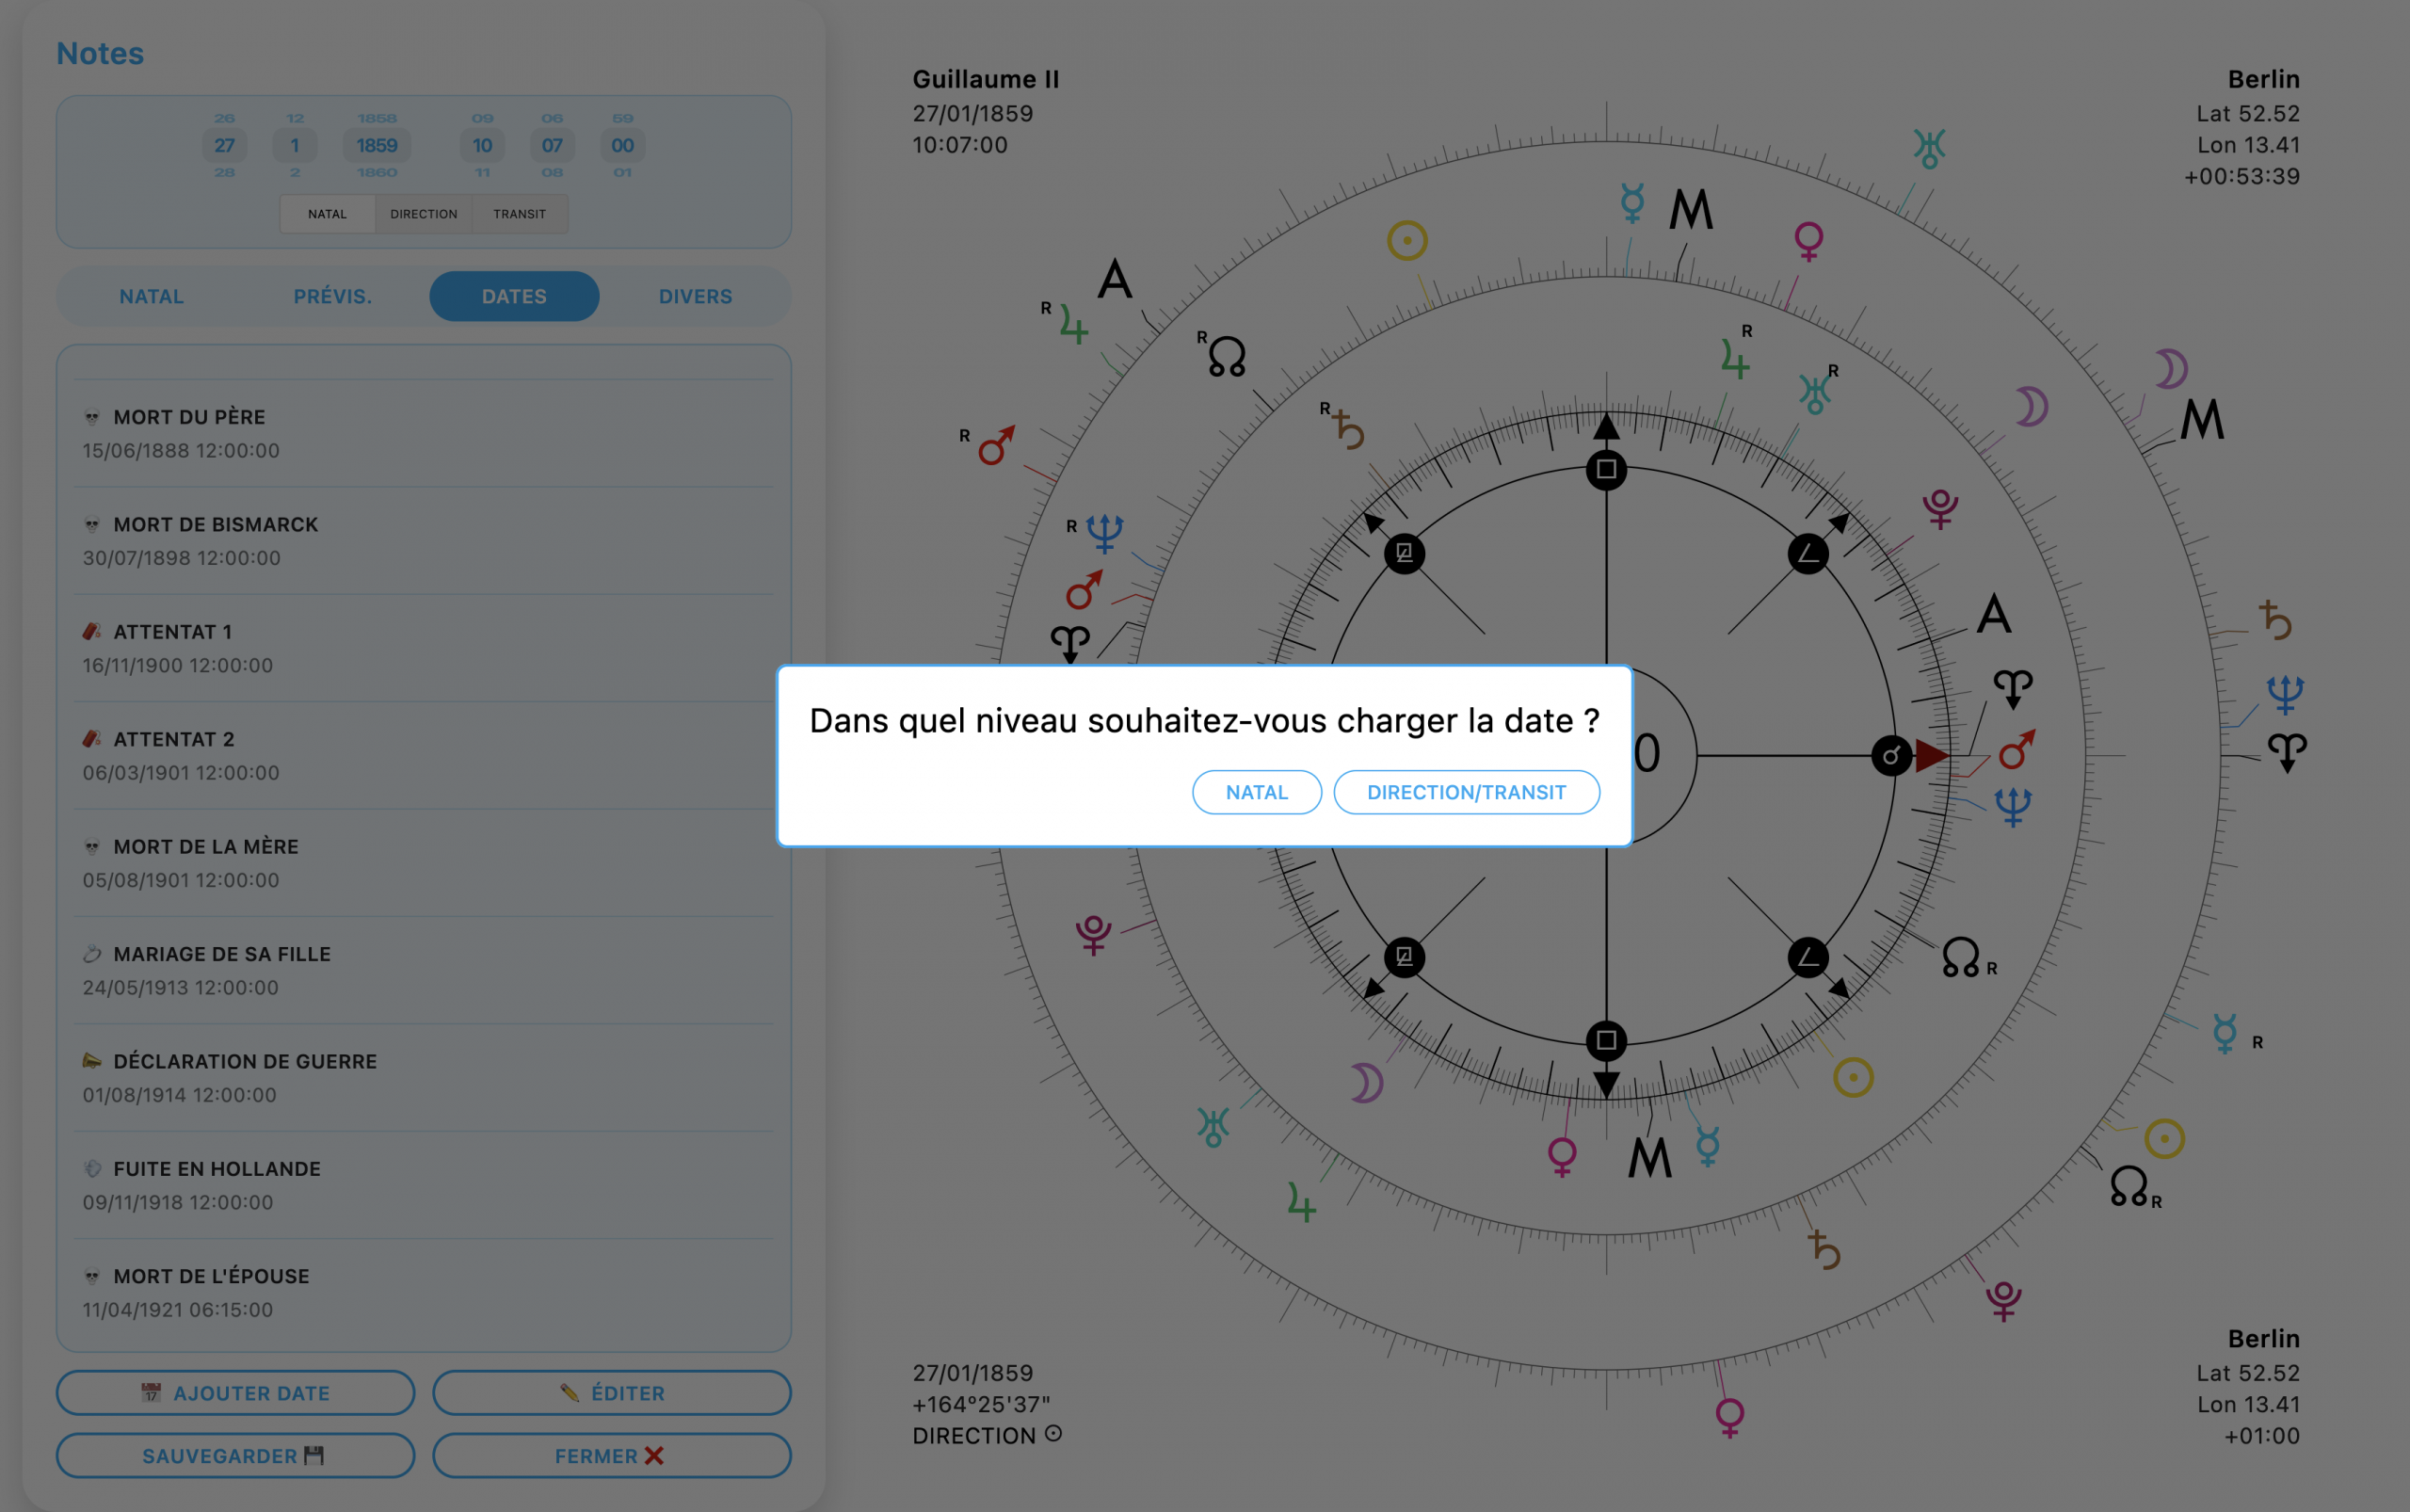
Thus, no more mistakes.
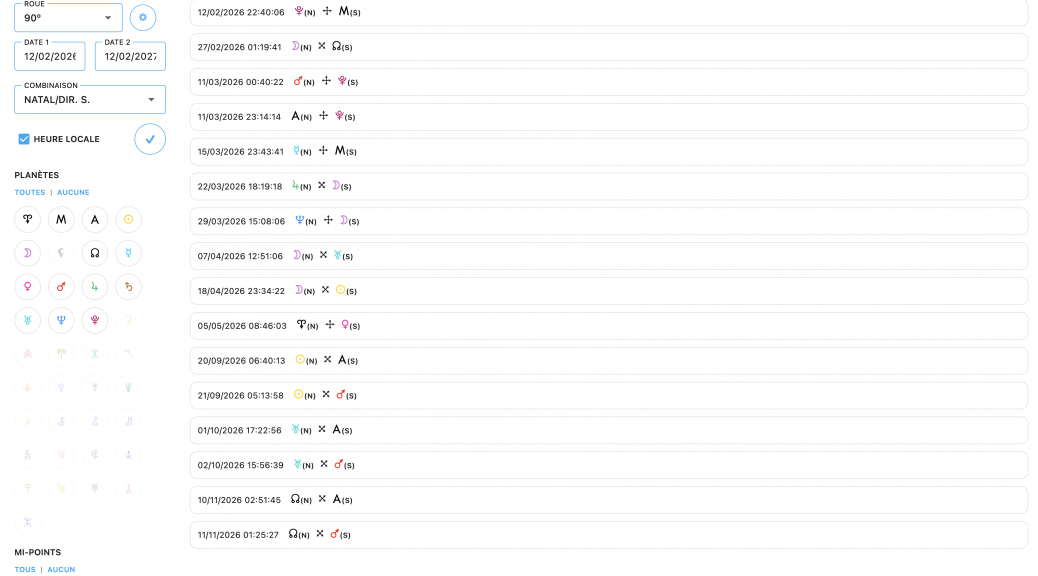
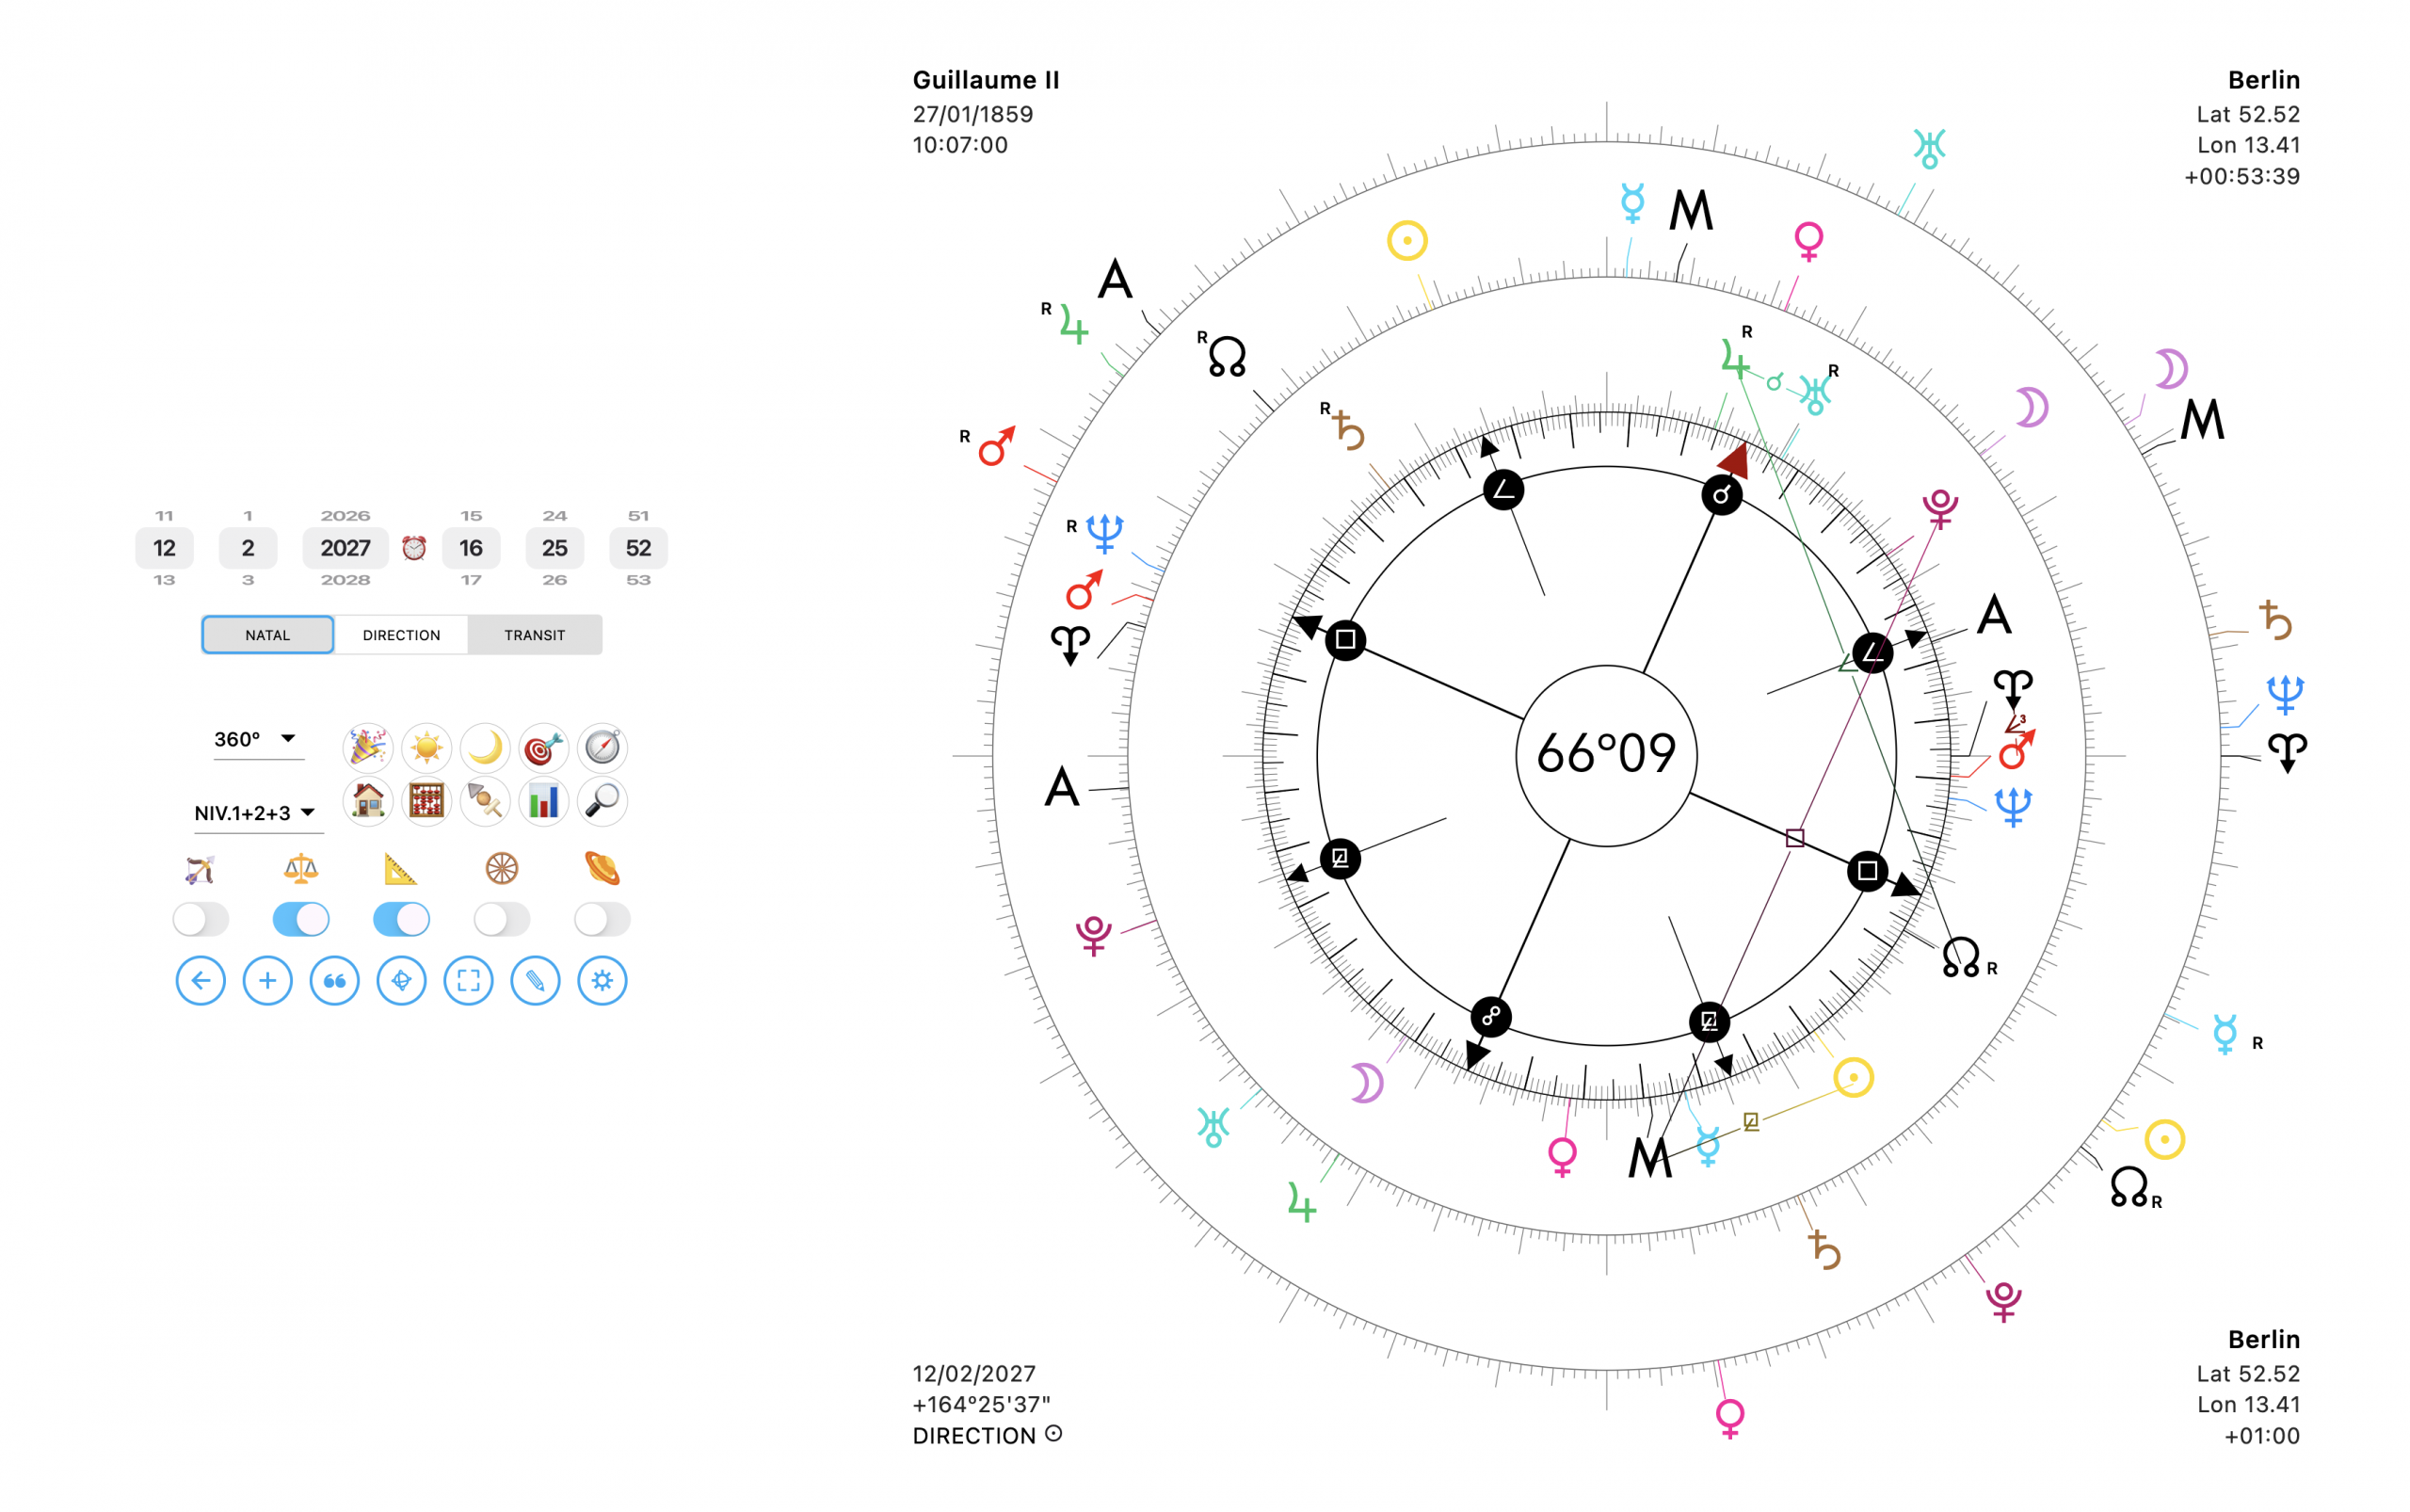
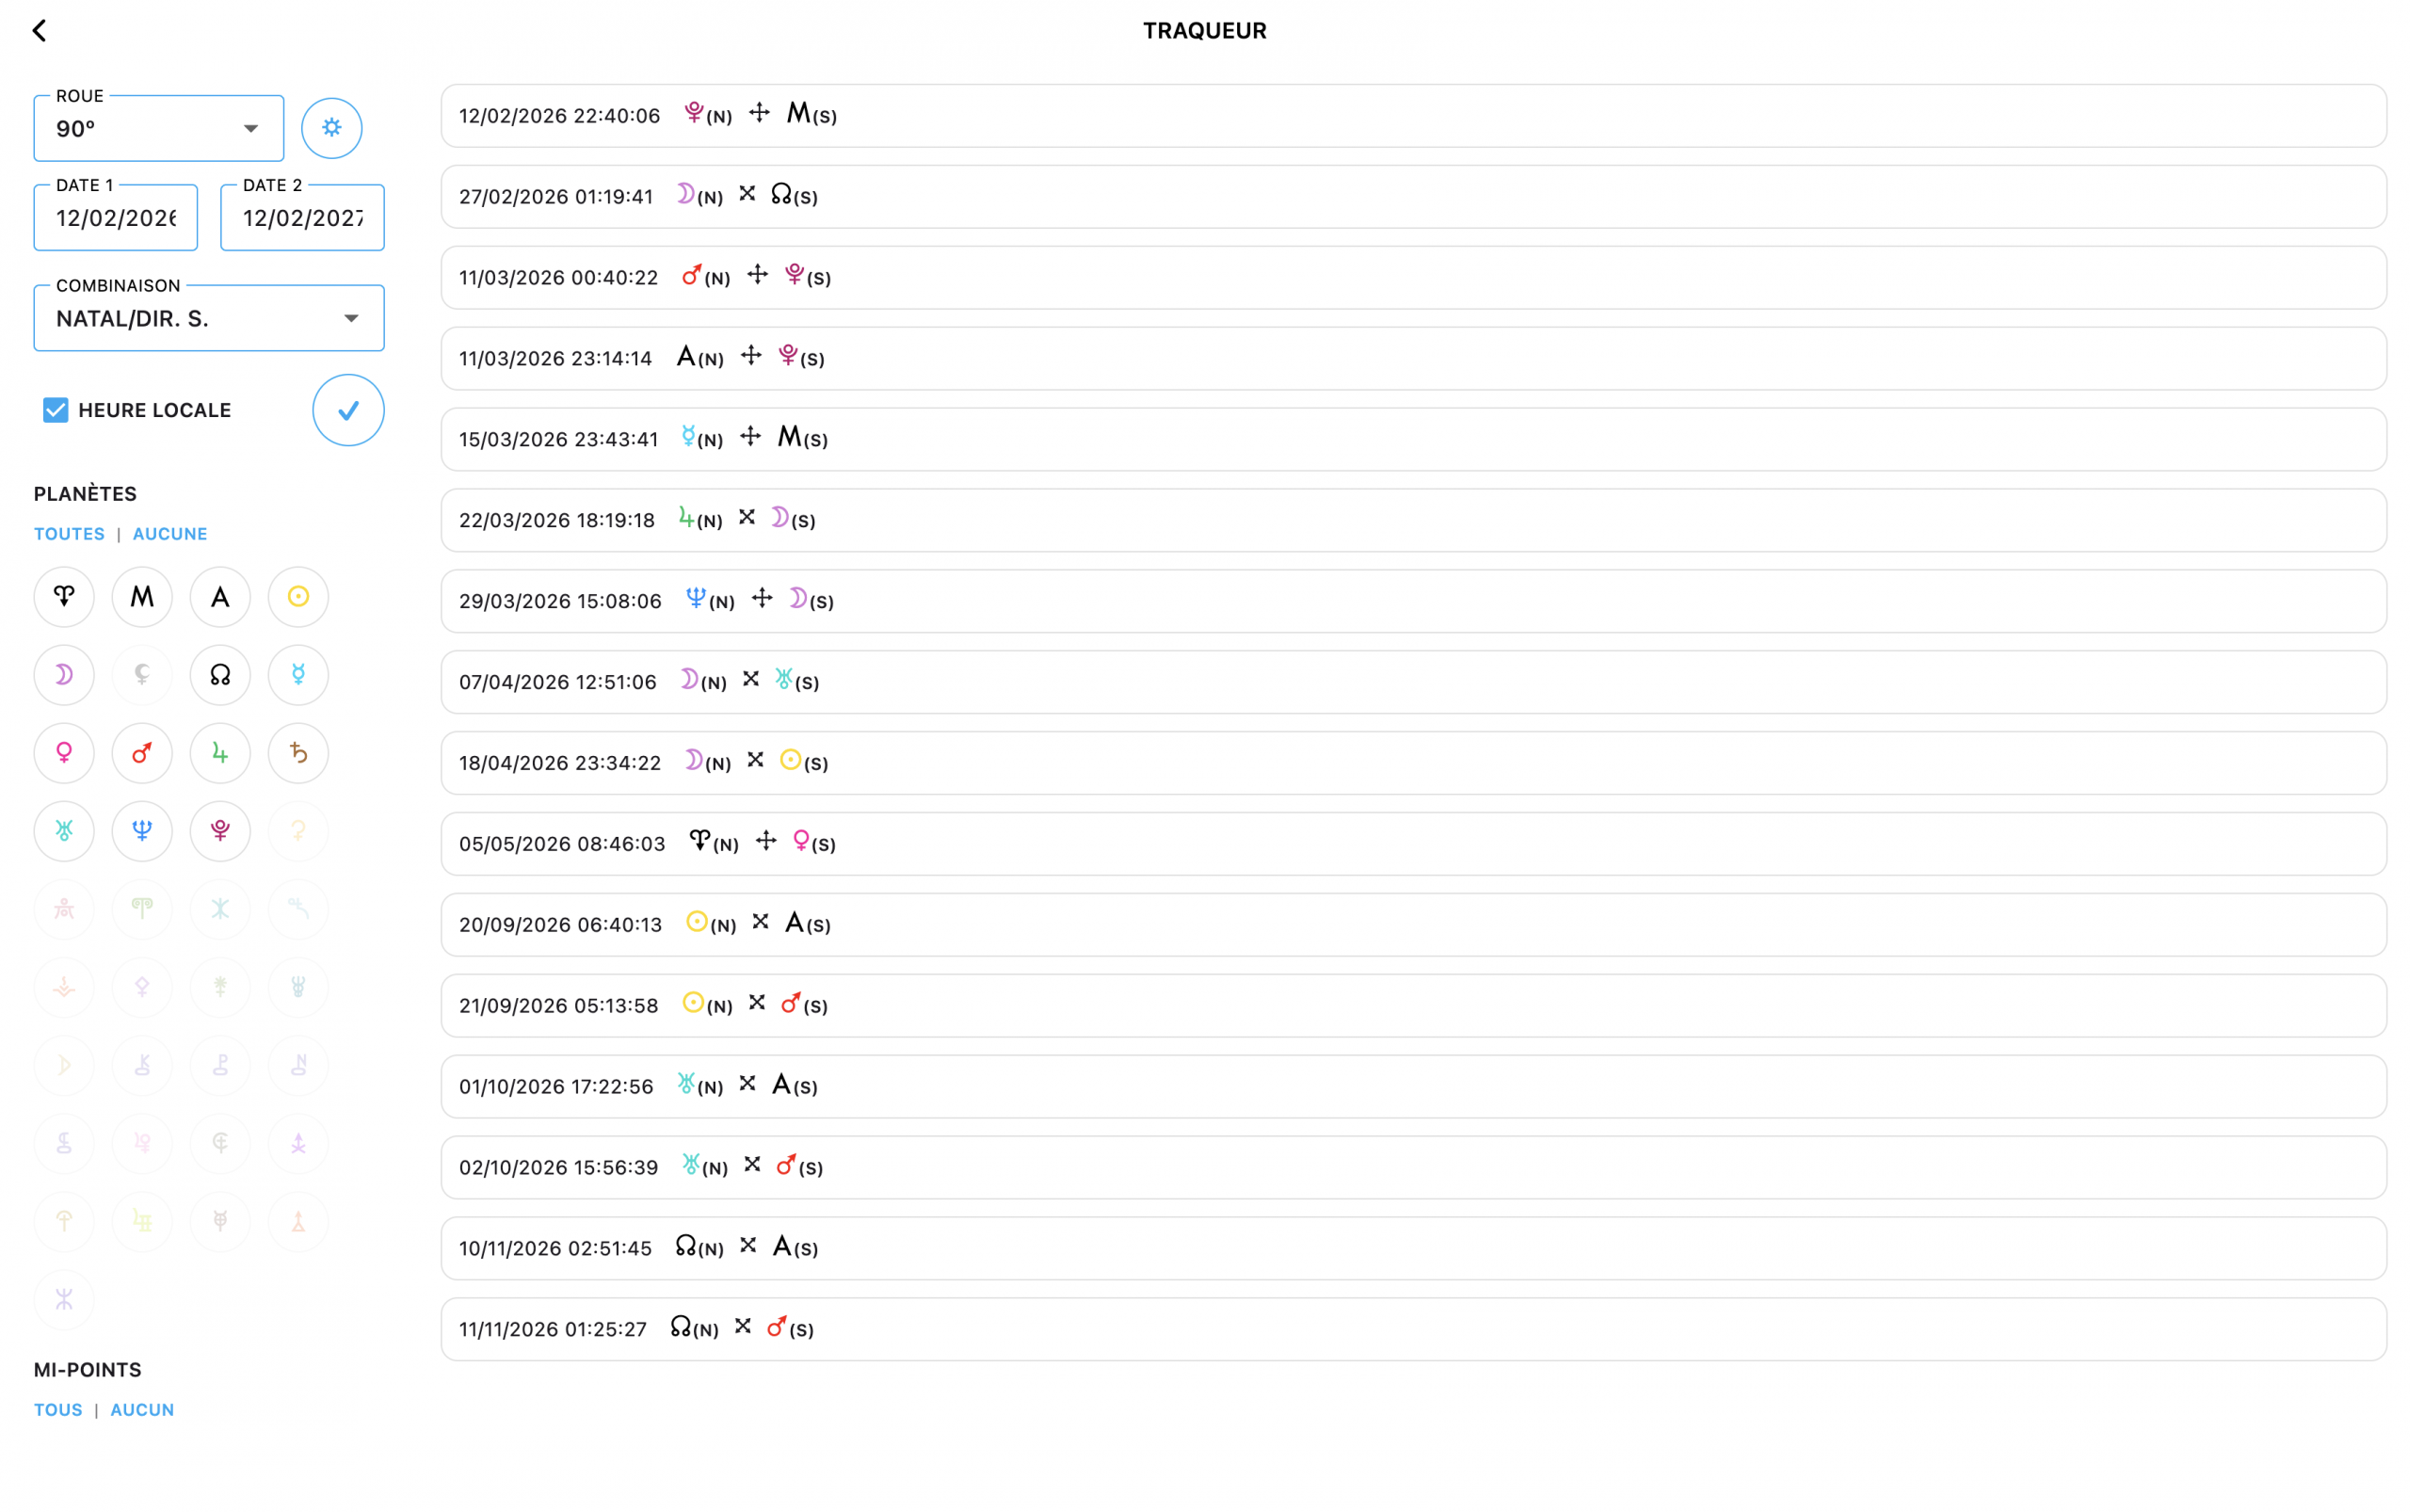
+ Another new feature: the date tracker.
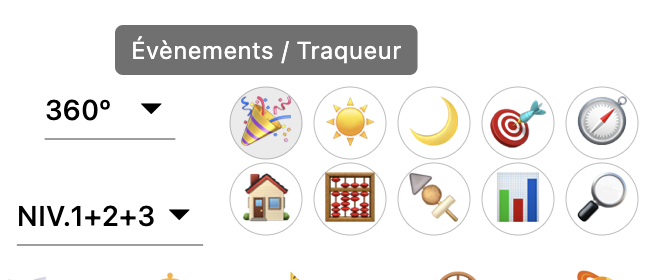
By long-pressing 🎉, you open the date tracker which lets you run a date-to-date search, according to the planets, levels, and wheels of your choice. The resulting list is clickable to directly display the chart with the corresponding date:
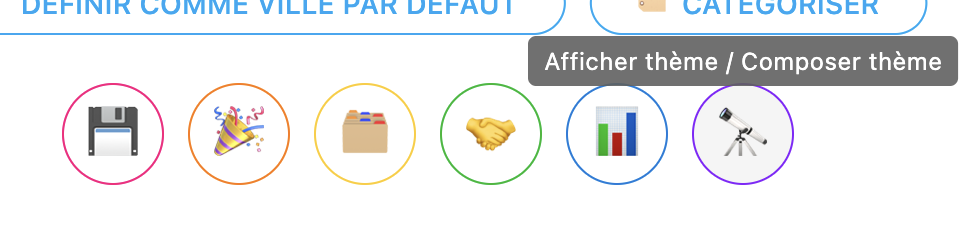
+ Yet another very practical new feature for people like me who need to generate teaching material, BUT reserved only for computers (Mac/Windows) because impossible on phones: the free composition function for a chart. It can be accessed from the chart creation page. The form does not need to be filled. You just need to long-press 🔭:
Which takes you to a blank chart with all the buttons to fill it. Click and hold on a planet to move it to the position and level you want (the tooltip gives you the degree info, and the natal level è, directed ê or transit ë). And with a right-click on placed planets, you can either change their degree or delete them.
You can of course select the number of wheels to display, if you want to use angles or sliders, read listings, take a screenshot, etc. For now, it’s still a “beta-test” that will need improving. Because some things are not quite ready yet (for example, you can single-click the buttons of the planets you want to add, it will immediately ask you at what degree, but not yet on which level, which therefore puts the planet by default on natal; so I need to fix that; but also the Notes button is still present and I forgot to disable it… oh well… that’ll be for the next update).
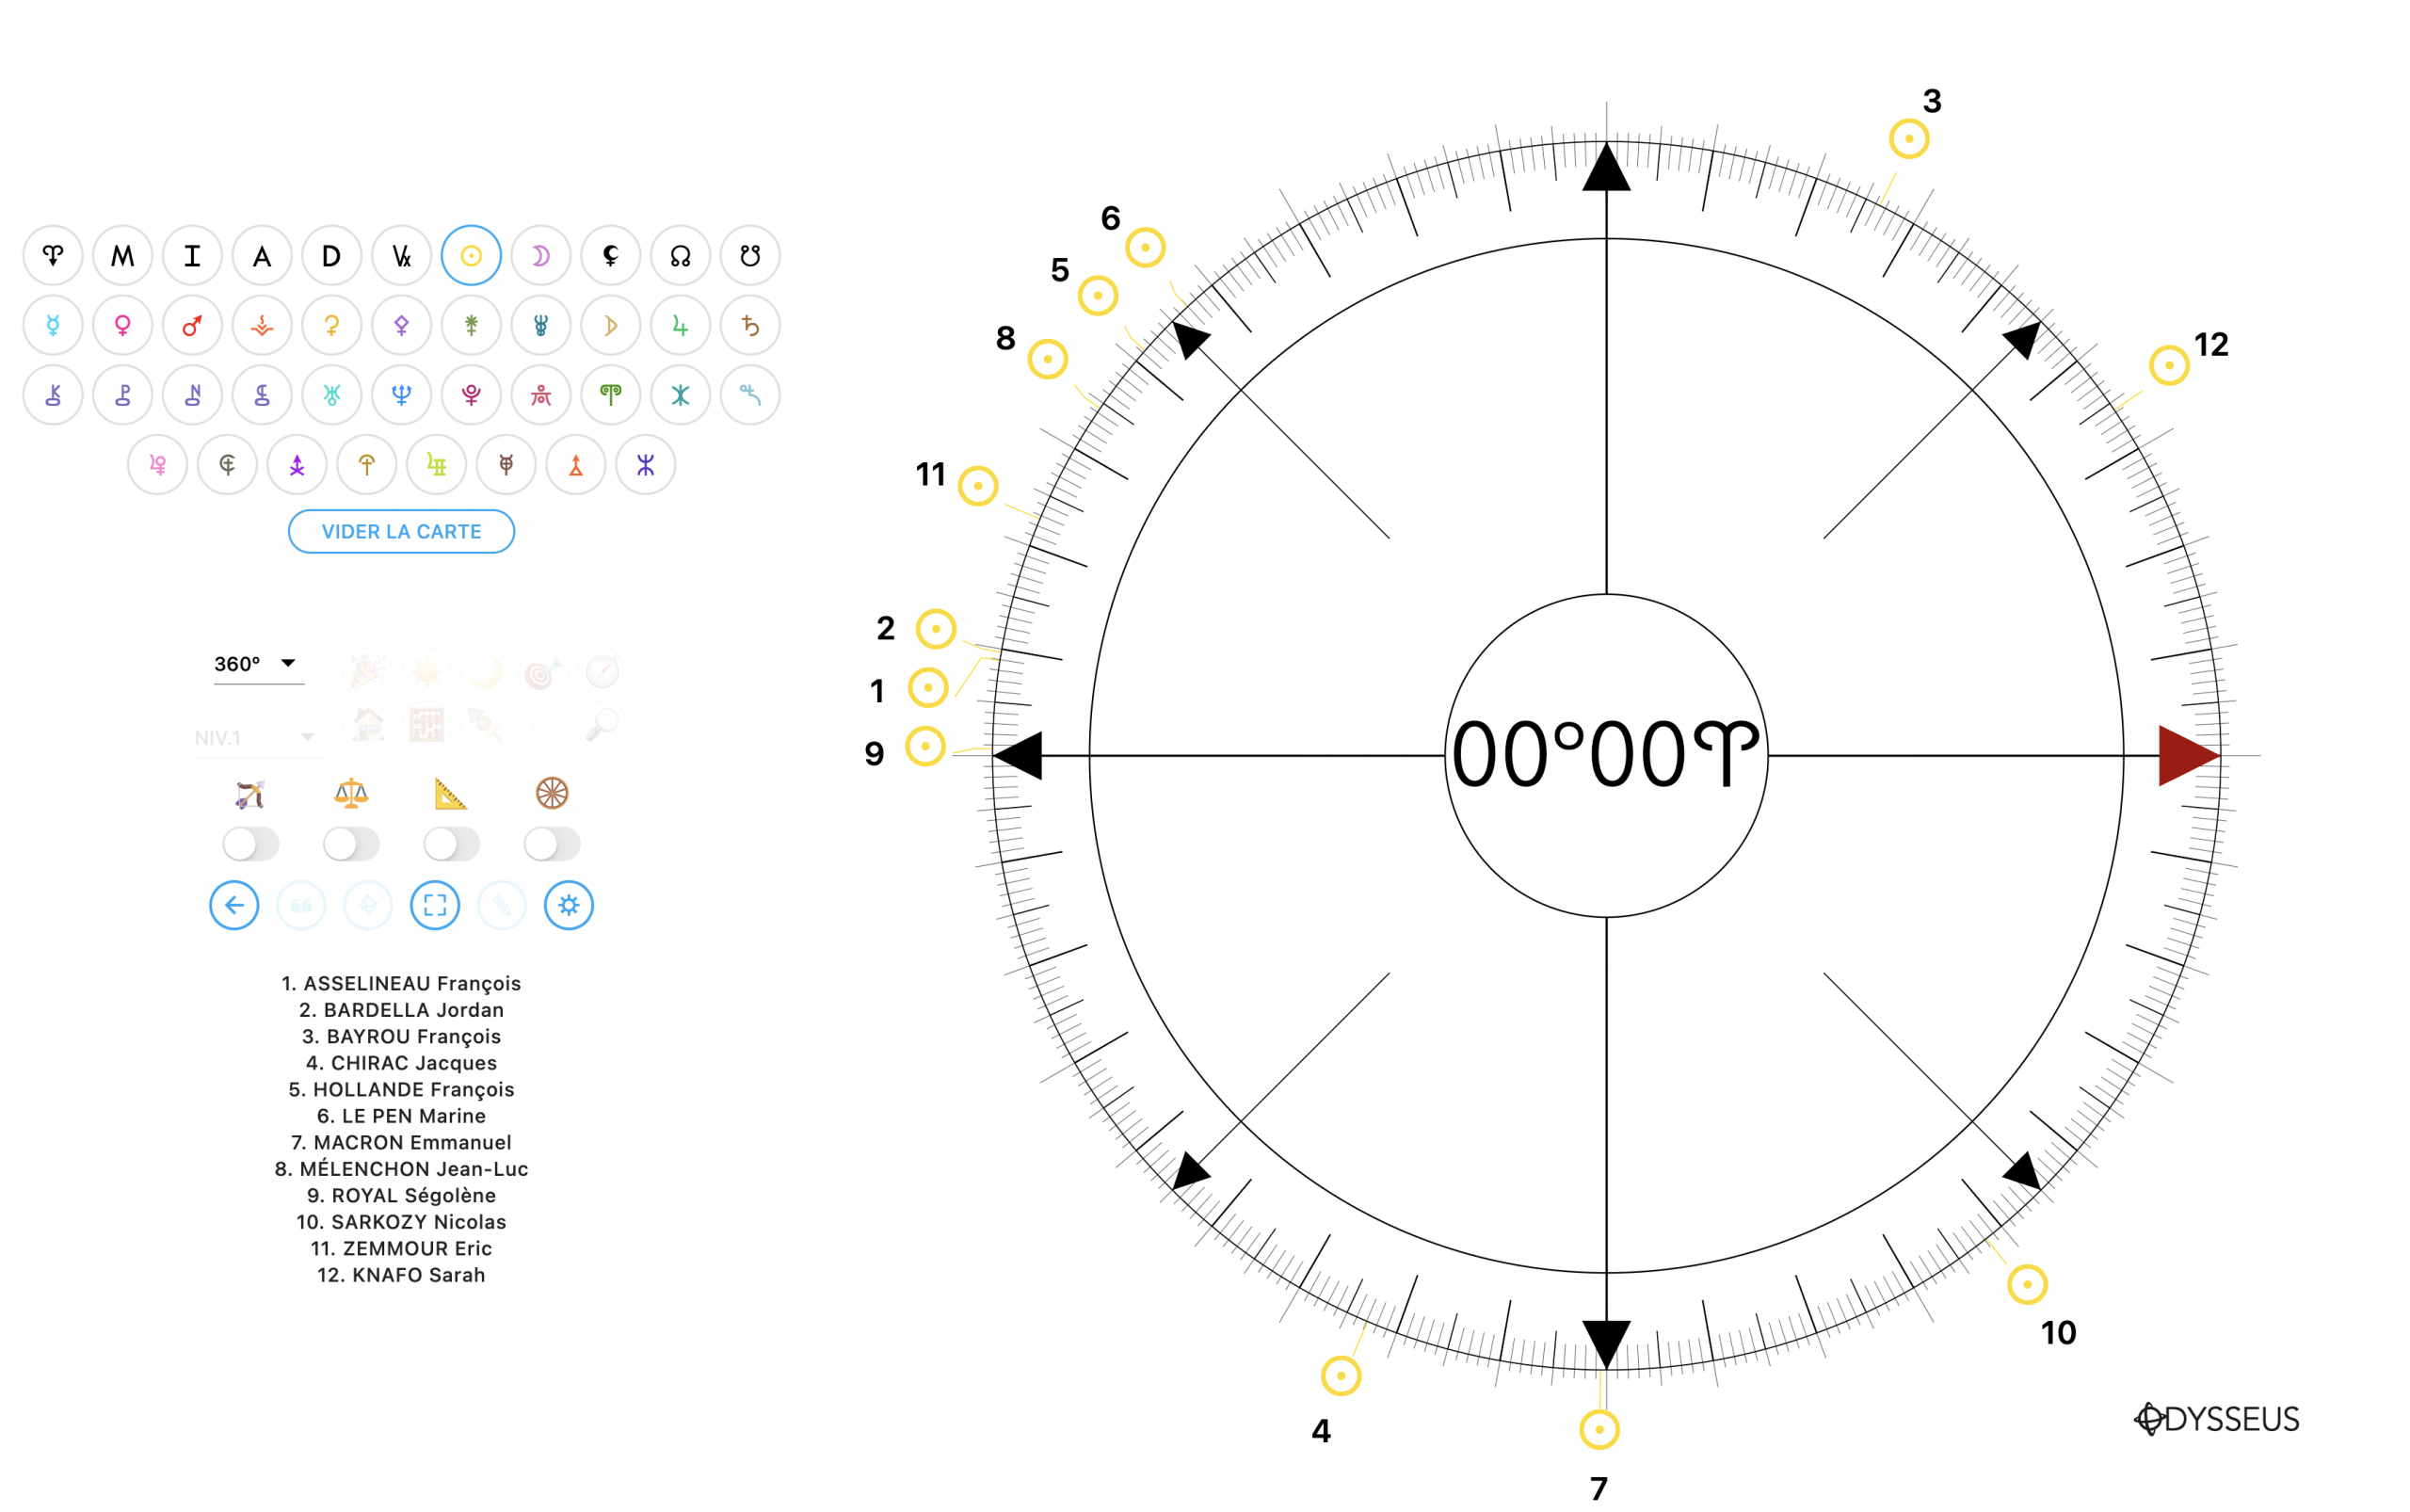
+ And finally, last new feature, also reserved for computers (because still impossible to adapt to small screens): multiple charts. It simply means opening several charts to display on the same wheel:
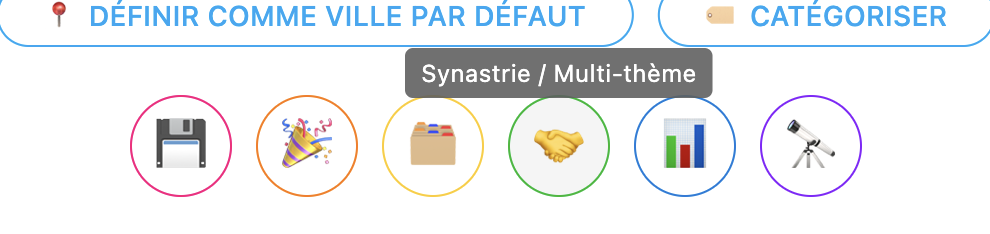
A long press on the 🤝 button opens the chart selector in which as many charts as you want can be loaded:
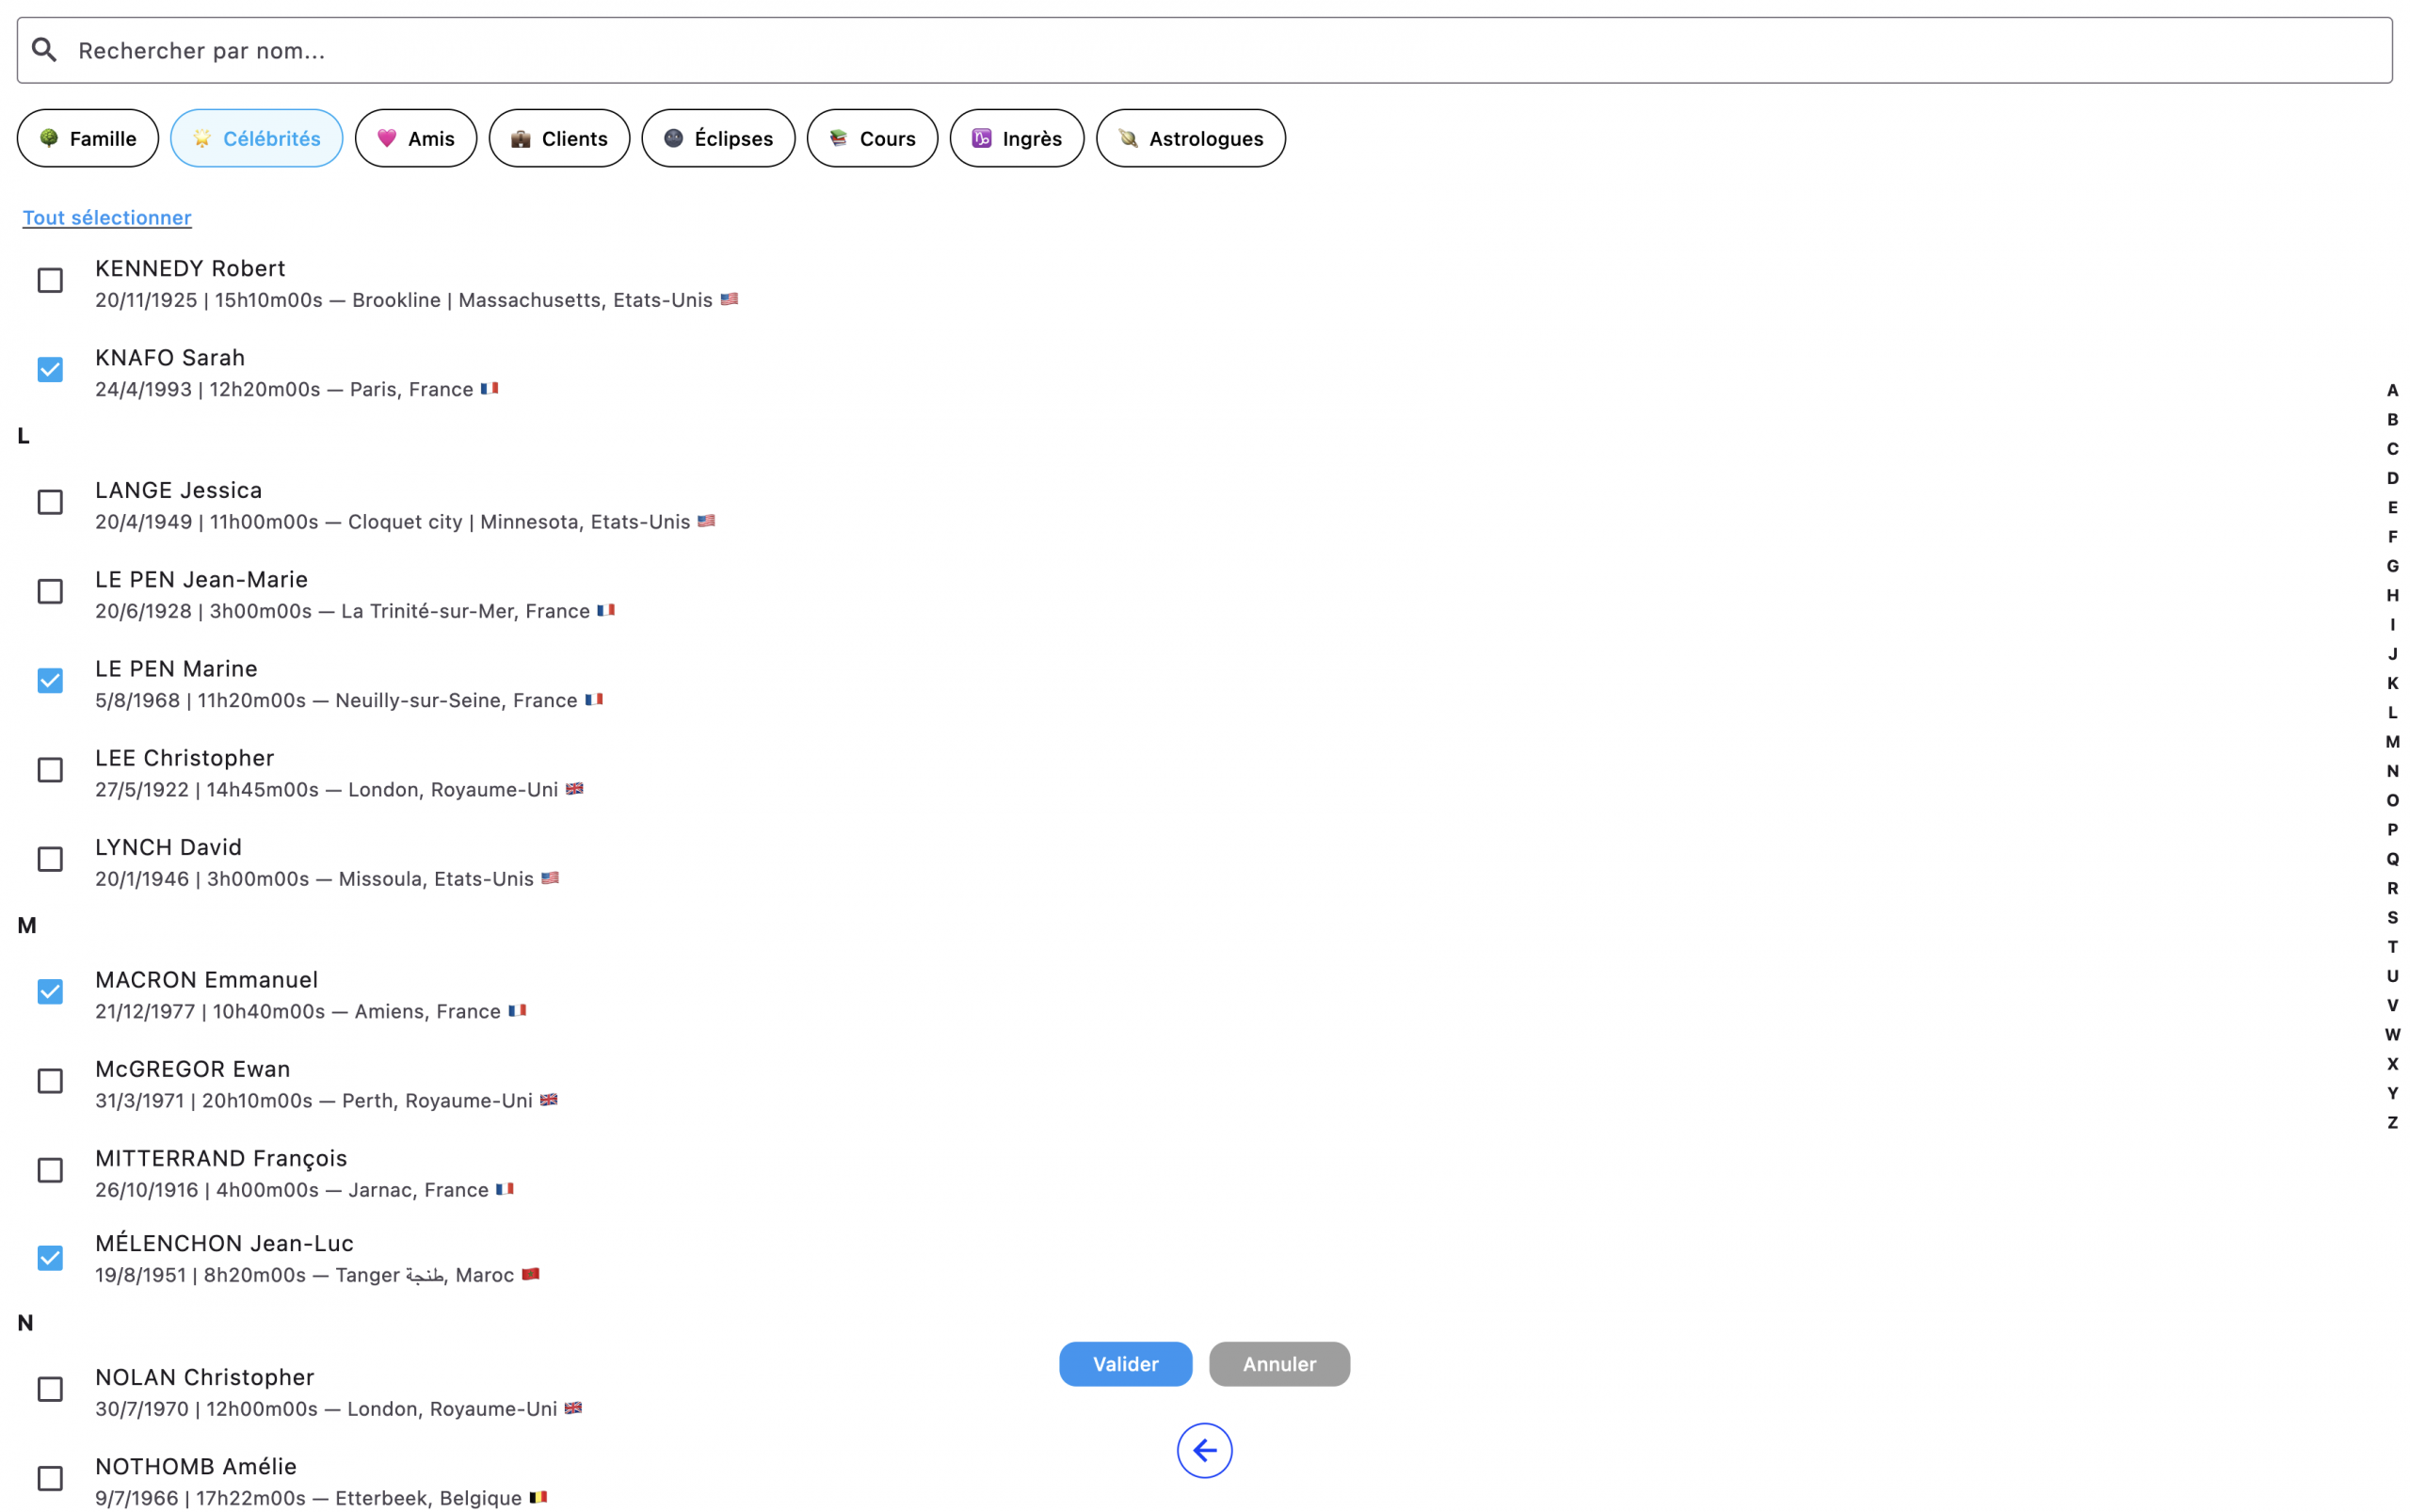
And once validated, you can choose the planet(s) you want to display on the wheel. And the planet(s) in question from each chart then appear on the wheel. It’s a tool used at the Hamburg School especially to see the coherence of a group or to find the birth day of those who don’t know it. But obviously, it’s a tool that won’t speak to many people…
Well there you go… that’s all… Kisses!